
Why good analytics data matters and what you can do with it
If you worked at Loom, the data below would allow you to do the following:
- Rescue slipping accounts before the QBR surprise
- Nudge power users into champions (and case-study stars)
- Time upsell offers when engagement is peaking
- Score trials so Sales stops guessing who's ready to buy
- Kill one-off support tickets with data that shows the full story
Most importantly, you can answer this question:
"Is this customer actually getting value from Loom?"
That list isn't theory. It's what Loom's CS, sales, marketing, and support teams could do tomorrow with the right events feeding Accoil.
Step 1: Define Loom's core value
Loom isn't just a video recorder. Loom sells async clarity for teams.
So the big question is simple:
"Is this account using Loom as a regular part of their workflow?"
Everything else from stickiness to expansion and referrals flows from that answer. Keep the question taped to your desk; it keeps the data plan lean and focused.
Step 2: What healthy Loom usage looks like
For a tool like Loom, a healthy account feels like:
- Many voices recording (not one hero user)
- Frequent sharing across roles and departments
- High view-through – people actually watch the videos
- Replies and reactions that prove async dialogue, not one-way broadcasts
- Weekly cadence – Loom pops up in rituals (Friday founder updates, demo loops, stand-ups)
That kind of activity leads to retention and expansion. For example, if engagement scores dip two weeks in a row, you could trigger a "save account" play.
Can you see that it's worth tracking more than just "number of videos recorded"?
Step 3: What should Loom track?
Loom doesn't need a 100-event firehose. Eighteen well-named events can tell the whole story.
What is product event schema?
A product event schema is the labels that are consistently applied to the actions your users take in your products.
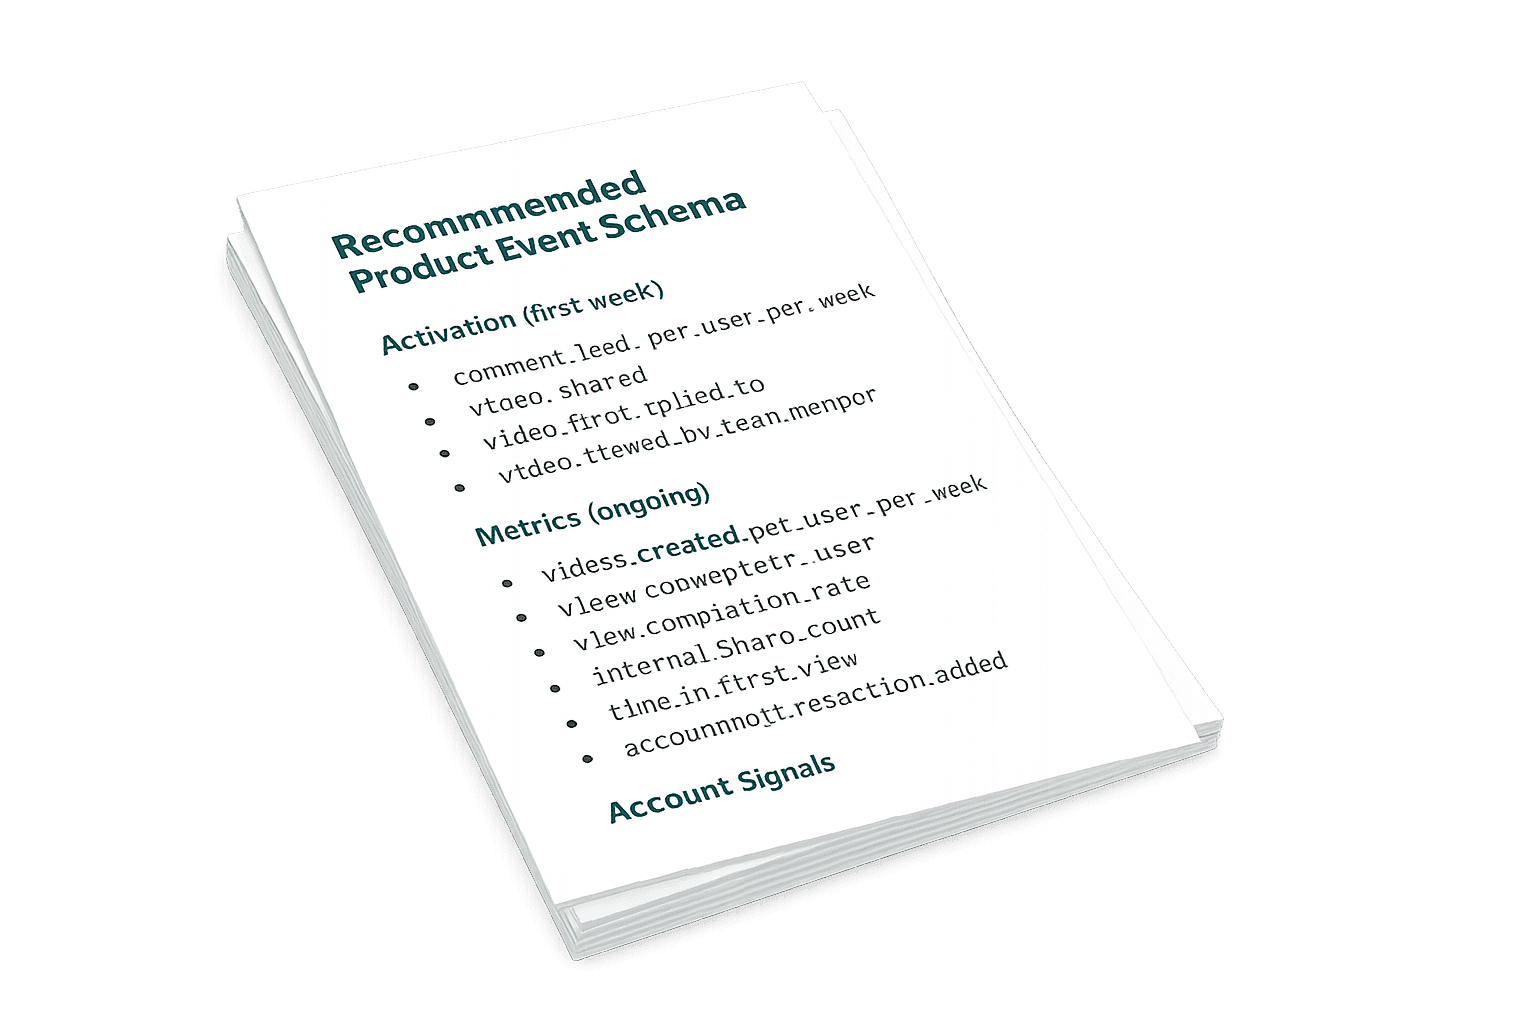
Here's our take on ~20 analytics events or signals that would show the Loom team what's really happening in their app:
Activation (first week)
comment_leftvideo_sharedvideo_createdvideo_first_replied_tovideo_viewed_by_team_member
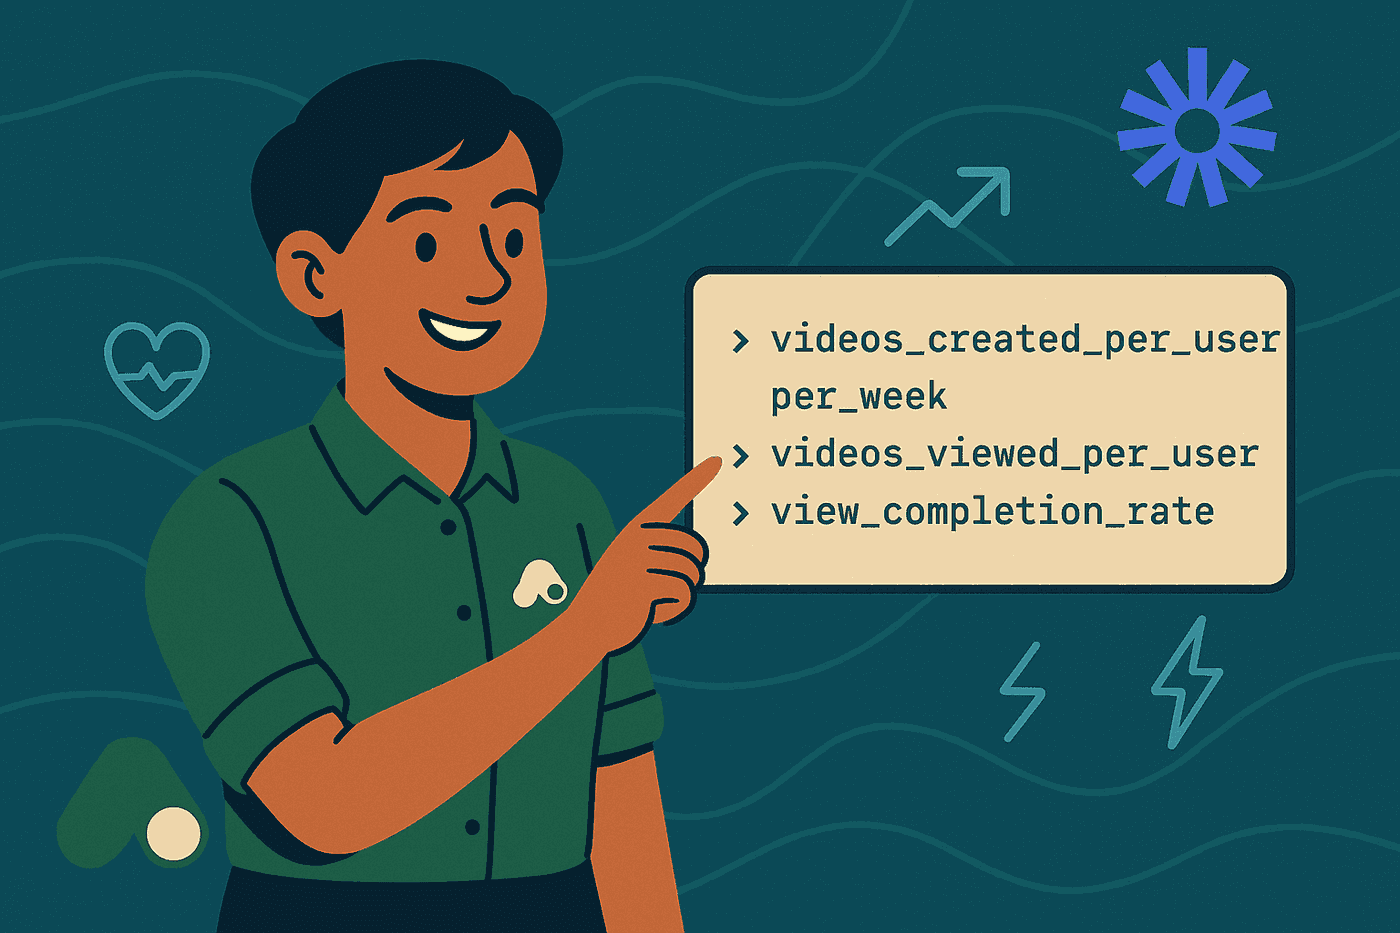
Metrics (ongoing)
videos_created_per_user_per_weekvideos_viewed_per_userview_completion_rateinternal_share_counttime_to_first_viewcomment_countvideo_emoji_reaction_added
Account Signals
engagement_dropoff(vs. prior 4 weeks)account_growth_rate(new users added who also engage)power_user_dependency(e.g. 80% of videos from 1 person)num_active_creators_per_weeknew team members who activate within X days% of invited users who've created/viewed a video
Step 4: How we would use this data
Armed with those events, the Loom team could build an account and user health model that rolls up these metrics:
| Metric | What it proves | Example next steps |
|---|---|---|
| Coverage (% of team creating or viewing) | Broad adoption > hero user | High → ask for story / Low → "who else should see value?" email |
| Interaction (shares, views, comments) | Loom is a two-way street | Dip → send async-best-practice video |
| Cadence (videos per week) | Part of workflow vs. novelty | Flat trend → offer "Loom in daily stand-up" template |
| Spread (creators vs. consumers) | Co-creation beats consumption | Skewed → run "record your first Loom" challenge |
| Trend (4-week changes) | Momentum, the best predictor of renewals | Down 15% → trigger save play |
It gives you clear, quantified account health signals. No guesswork. And these are just a sample of the metrics and next steps Loom could track and action.
Final Thought
Product analytics isn't about counting clicks; it's about proving value. When your data:
- Flags customers who are getting value, you can celebrate and expand them
- Highlights customers who aren't getting value, you can intervene while there's still time
For Loom, that means zooming in on collaboration, engagement, momentum, and spread; the exact signals Accoil was built to surface.
Plug in the events above, let Accoil crunch the score, and give your CS team the super-power they've been promised.
Free Product Event Schema Builder
Not sure how to start tracking product events? No worries.
Enter your business email (with your company's domain) below. In 24 hours you'll have a report just like the one above.