TL;DR: Product Qualified Leads (PQLs) are your sharpest insight into whether users are experiencing value, not just logging in. This blog breaks down four core metrics that go beyond vanity: they show how many users are activating, how fast they do it, how well they convert, and how GTM teams can use that data to take action.
Know What Counts: Define Value Before You Measure It
A Product Qualified Lead is someone who's gone beyond the surface and hit a moment of value. They've used the product in a meaningful way, now they're primed for conversion.
In Accoil, activation is measured by how far a user (or account) has progressed through a set of key steps you define (like adding a teammate, completing a core workflow, or reaching a feature threshold). This is tracked as an Activation Rate. If there are four steps and a user completes three, they're 75% activated.
The key is clarity: define those steps with precision. Choose actions that actually reflect product value, not vanity usage.
1 – How Many Users Reach Activation?
Your product-driven pipeline starts with tracking how many users are doing what matters most inside your product.
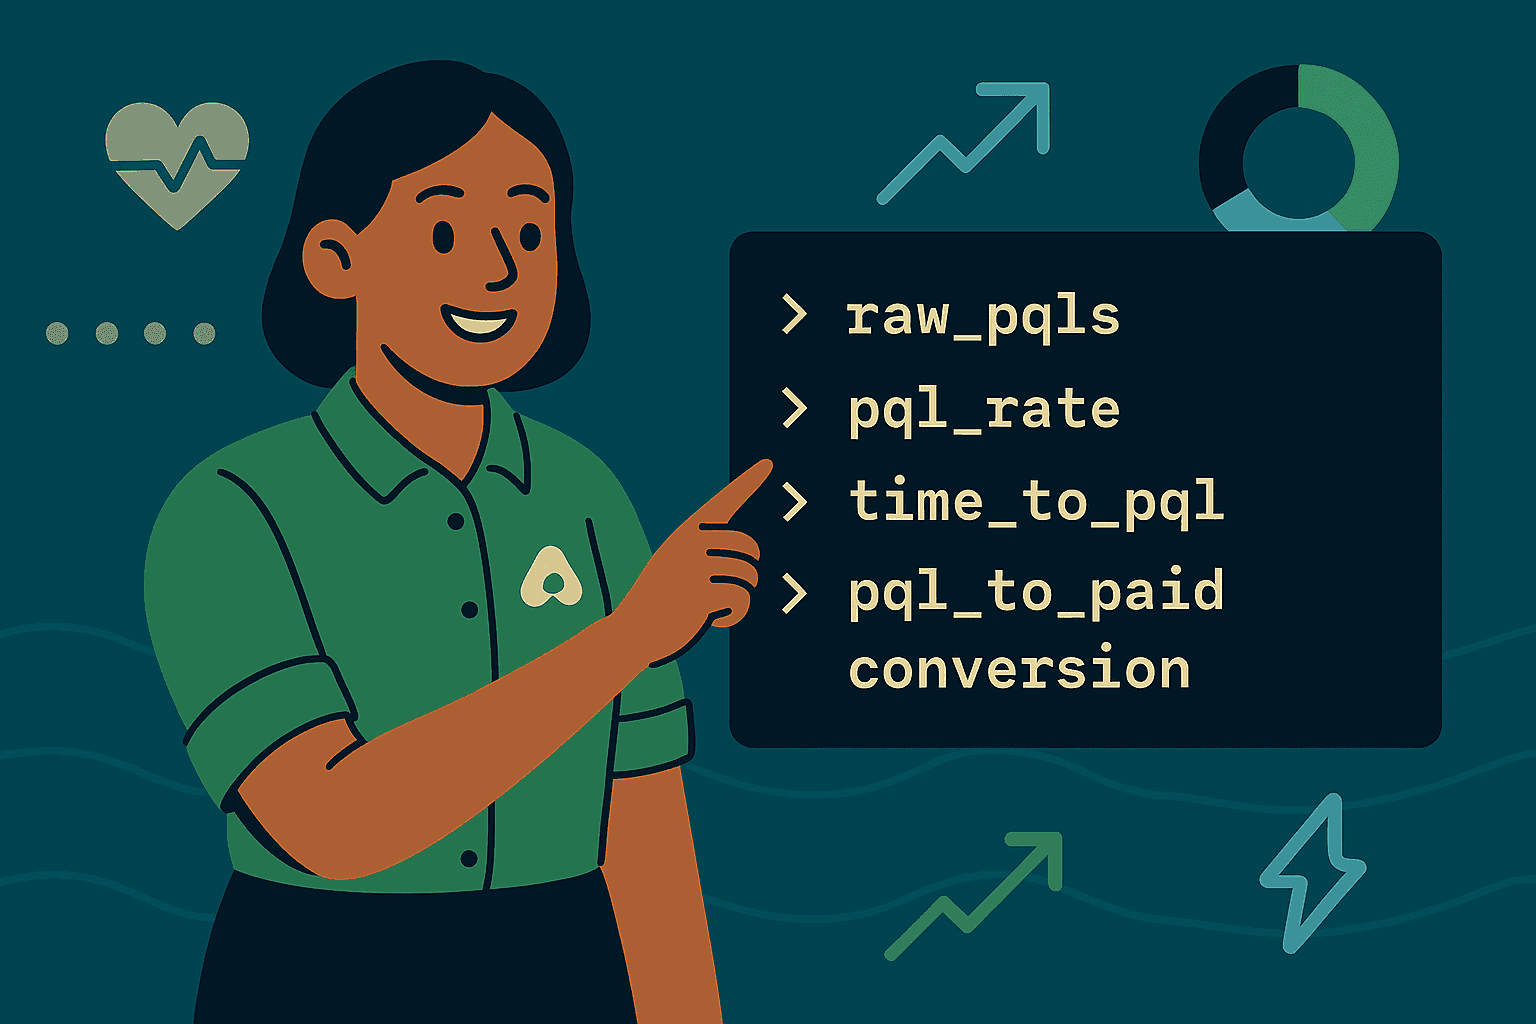
You can't close what you can't see, so track these activation-related metrics:
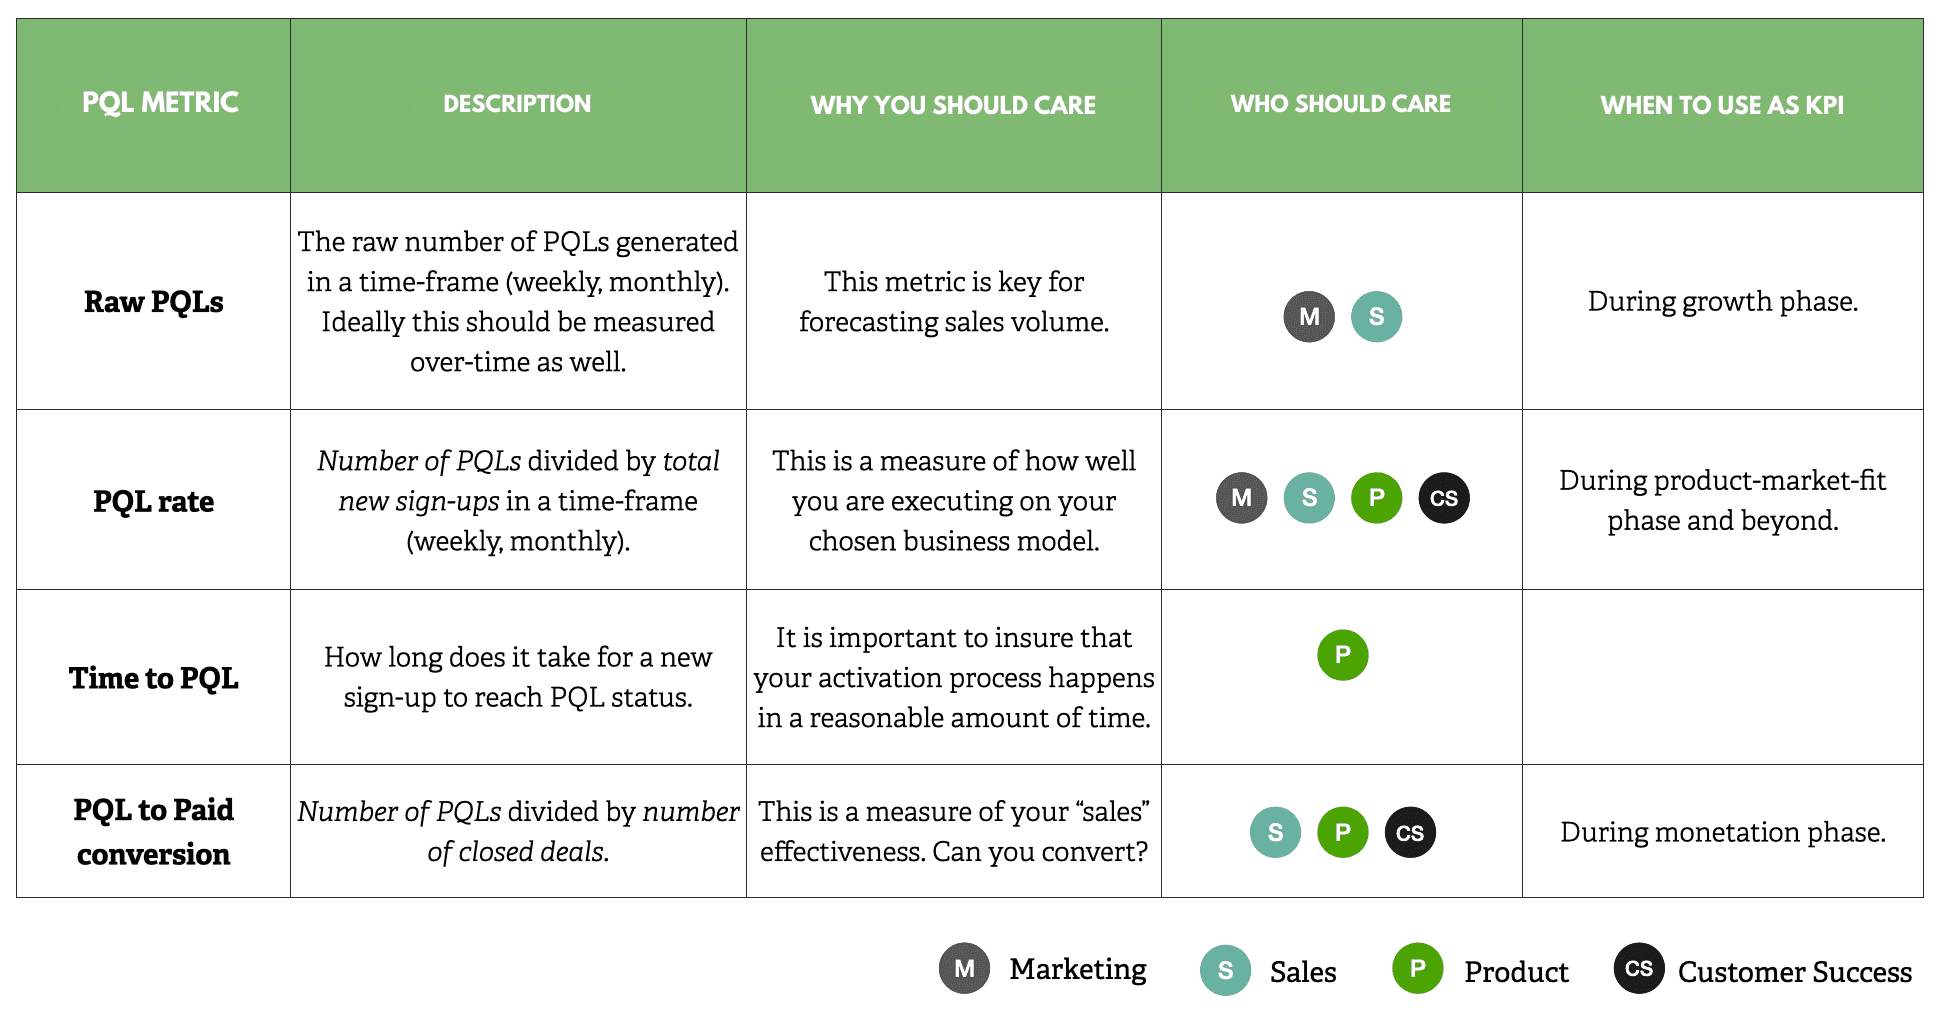
- Raw PQLs tell you the total number of users who've hit your defined moment of value.
- Current PQLs show what's in play right now. They are your active, ready-to-move leads.
- PQLs over time reveal trend lines across weeks or months, so you can see growth, drop-off, or seasonality.
Each one gives you a sharper picture of where your product is generating momentum.
2 – What Percentage of Users Actually Activate?
Not every signup makes it to value. PQL Rate shows how many do. It also shows how well your product and onboarding are working.
- High PQL Rate? You're attracting the right audience and guiding them to value.
- Low PQL Rate? There's friction…could be in the product, UX, or expectation-setting.
3 – How Fast Do Users Get to Value?
Time to PQL shows how long it takes a user to reach that activation moment. And speed matters.
The faster someone sees value, the better your odds of converting them.
If users are still wandering around on Day 12 of a 14-day trial, something's broken. Track this. Improve it.
4 – Are Your Activated Users Converting to Paid?
This one's simple: If people reach value and still don't pay, you've got a bigger problem.
PQL to Paid Conversion Rate tells you whether your product delivers value people will pay for.
- If it's low, check pricing, upgrade flow, or perceived value.
- If it's too high, you might be undercharging.
What GTM Teams Should Do With This Info
Product
- Use PQL Rate to gauge onboarding performance
- Monitor Time to PQL to surface friction
- Track PQL to Paid to prove product-led growth
Marketing
- Own Raw PQLs as a leading indicator of lead quality
- Use PQL Rate to test messaging resonance
Sales
- Prioritize the PQL list. These are your warm leads
- Watch conversion rate to improve handoff timing
Customer Success
- Help shorten Time to PQL through onboarding and support
- Track PQL to Paid to spot handoff or retention gaps
Choose Your North Star (But Keep the Others Close)
Each of these four metrics tells a different part of the story. Track all of them, but based on what your team is solving for right now, elevate one as your KPI:
- Need growth? Raw PQLs will show you if your reach and activation are aligned.
- Improving activation? PQL Rate reveals how effectively users hit value.
- Speeding up conversion? Time to PQL helps you spot delays.
- Monetization focus? PQL to Paid Conversion is the revenue signal.
Each missed PQL is revenue left behind.
Accoil gets those signals in front of the teams who can close, convert, and keep them.