
Recently a customer pinged us in Slack with the kind of question that gets to the heart of it:
"Okay, but what do I do with this score?"
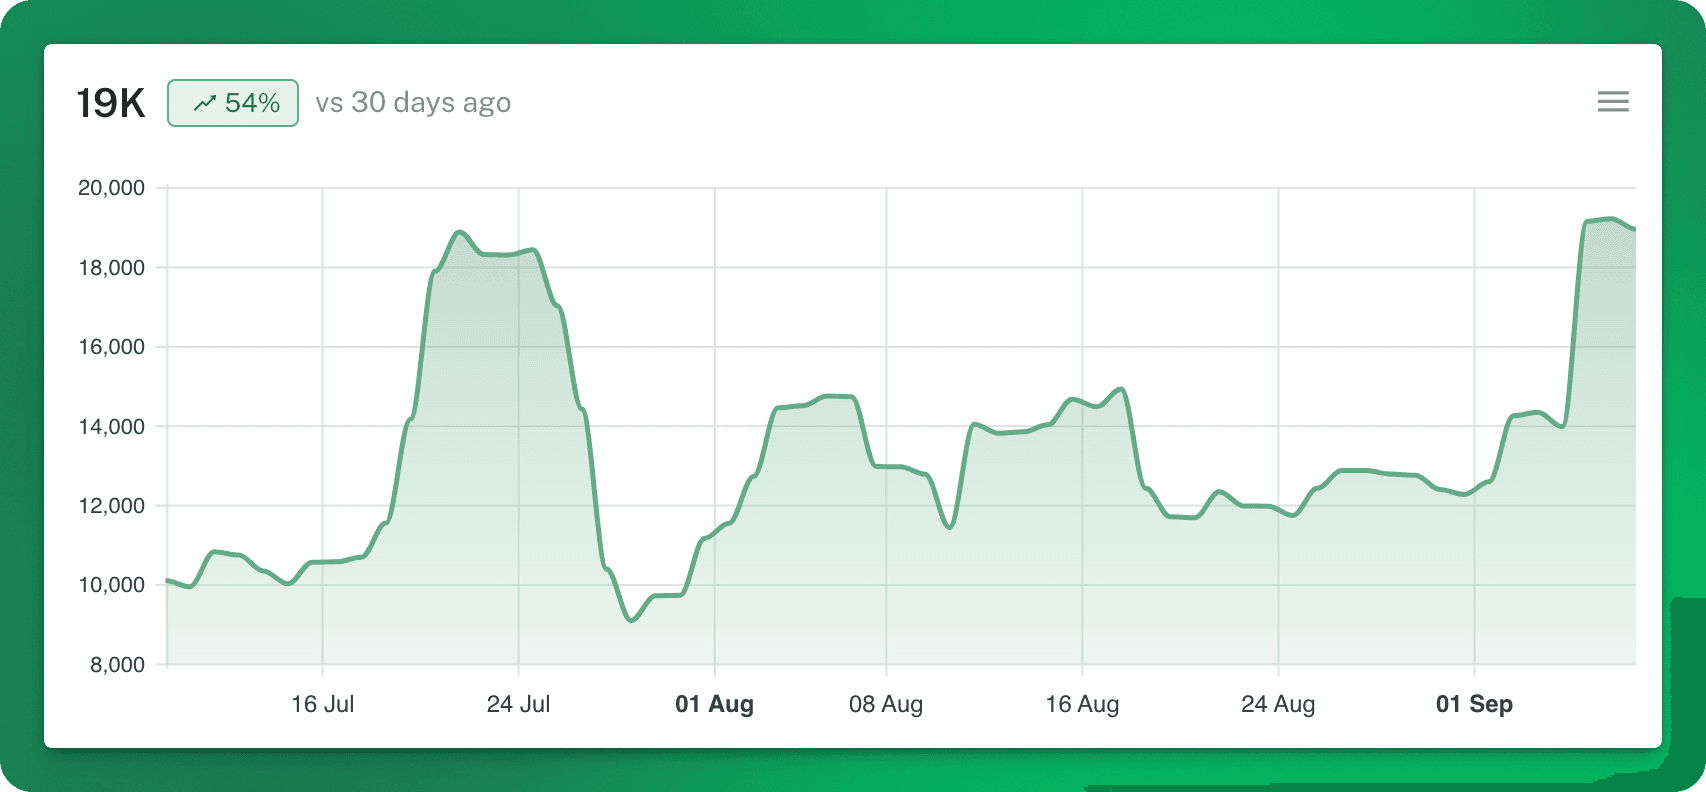
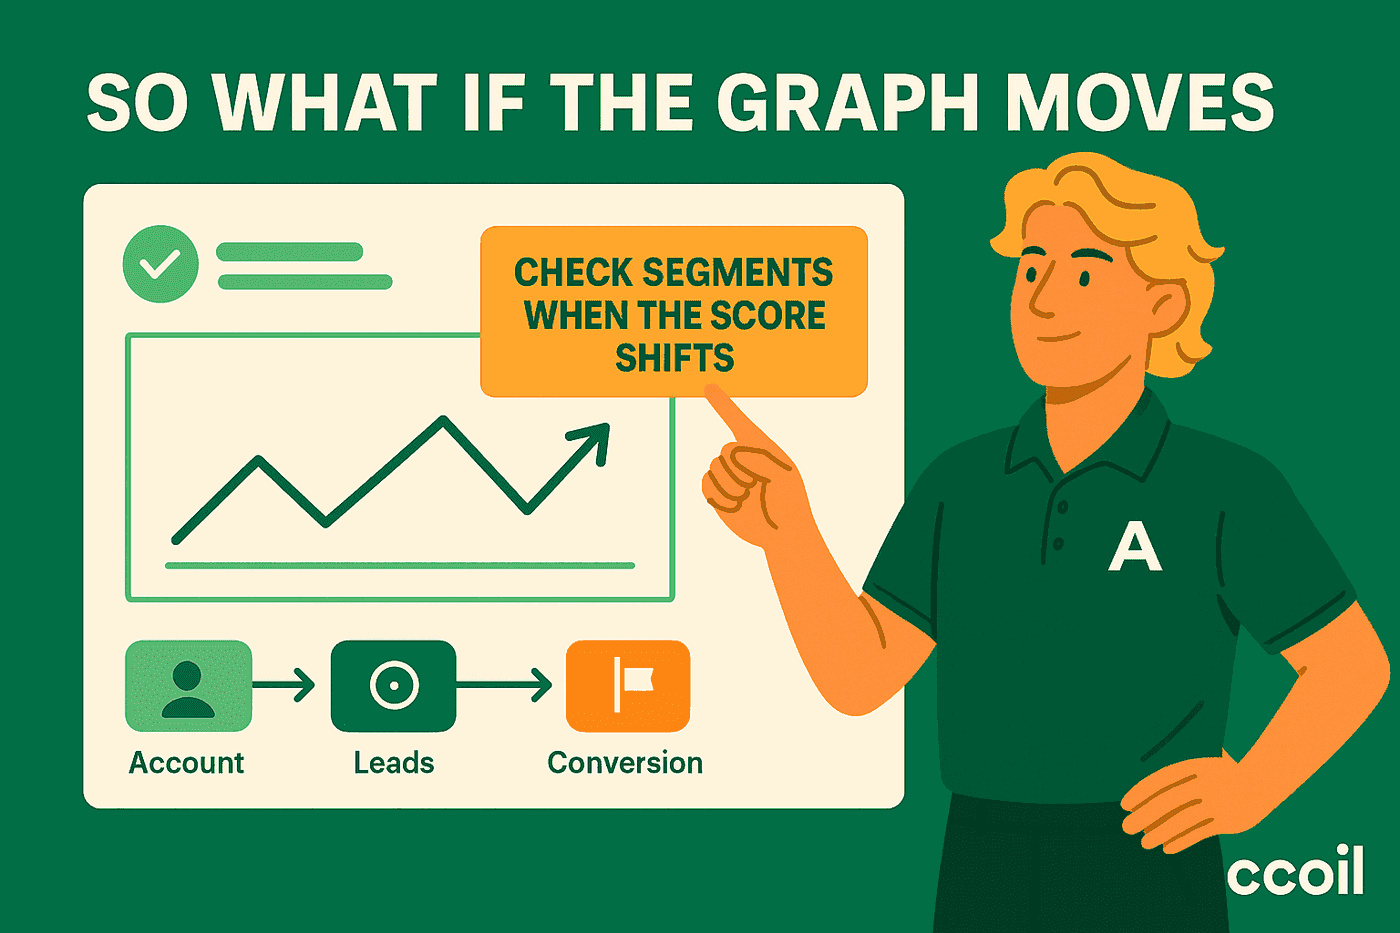
They were looking at the total product engagement graph — a sum of all raw scores across accounts and users. A familiar chart. Up, down, sideways.
And it's a fair question.
Because yes — total engagement going up and to the right is great. It means more usage, more adoption, more people doing more things in your product.
But also? That number alone doesn't tell you what changed. It doesn't tell you who's slipping through the cracks.
Total engagement is your traffic light. Not your map.
- Green? Probably fine.
- Red? Time to pay attention.
- Amber? Better check the segments.
The graph is useful — it's more dynamic and engaging than a basic health light. But at the end of the day, it's still just that: a signal.
It's the "you should probably go dig" warning. Not the shovel.
Here's what digging looks like:
- Which of your top enterprise accounts just dropped into the "at-risk" segment?
- Which previously active customers have gone quiet — and stayed quiet?
- Which of your biggest logos haven't even touched that new feature you shipped last month?
That's where the value is. Not in the total, but in the deviation. The shift. The absence. Because churn rarely announces itself. It just stops showing up.
So what do you do with the score?
You go check the segments.
That graph exists to nudge you — to say, "Hey, something's changing."
But it's up to you to look deeper:
- Slice the score by customer tier, segment, lifecycle.
- Look at the enterprise cohort.
- Set alerts for accounts trending down over the last 14 days.
- Investigate which health scores just crossed a threshold.
It's not the graph that saves you. It's what it tells you to go check.
So when someone asks, "What's the point of this?"
That's the point.
The total score won't tell you what to do.
But it will tell you when it's time to start looking.