The Covid-19 pandemic has changed how we live, work and shop. It's forced us to rethink almost every part of our SaaS business. Now, keeping your current customers is more important than hunting new ones.
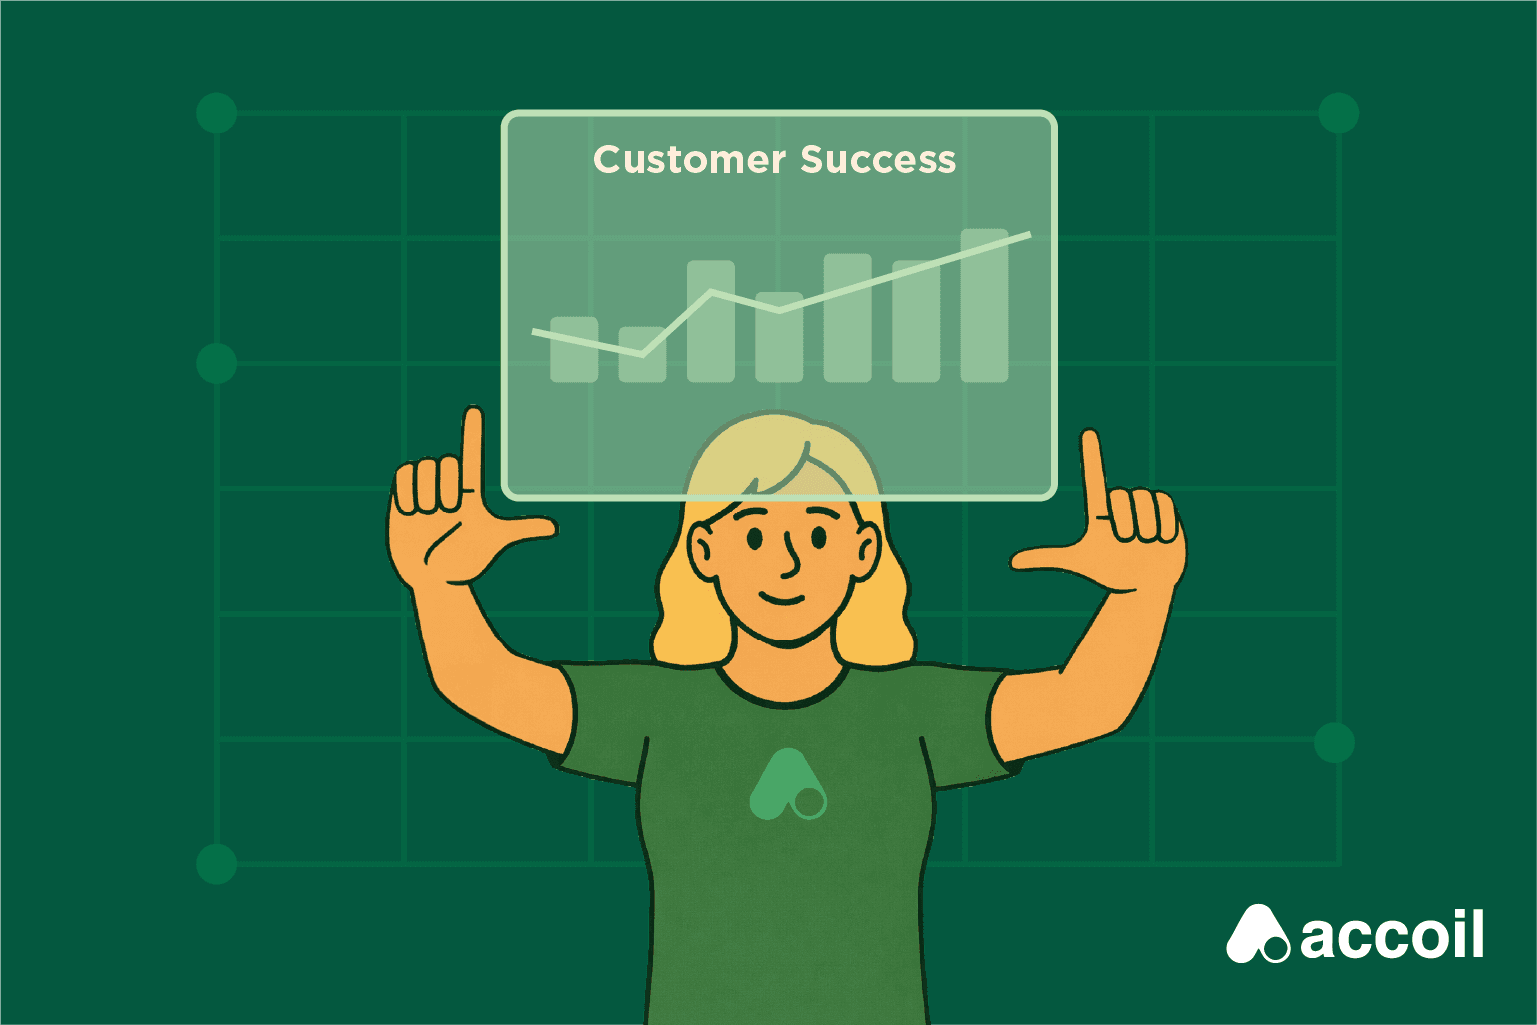
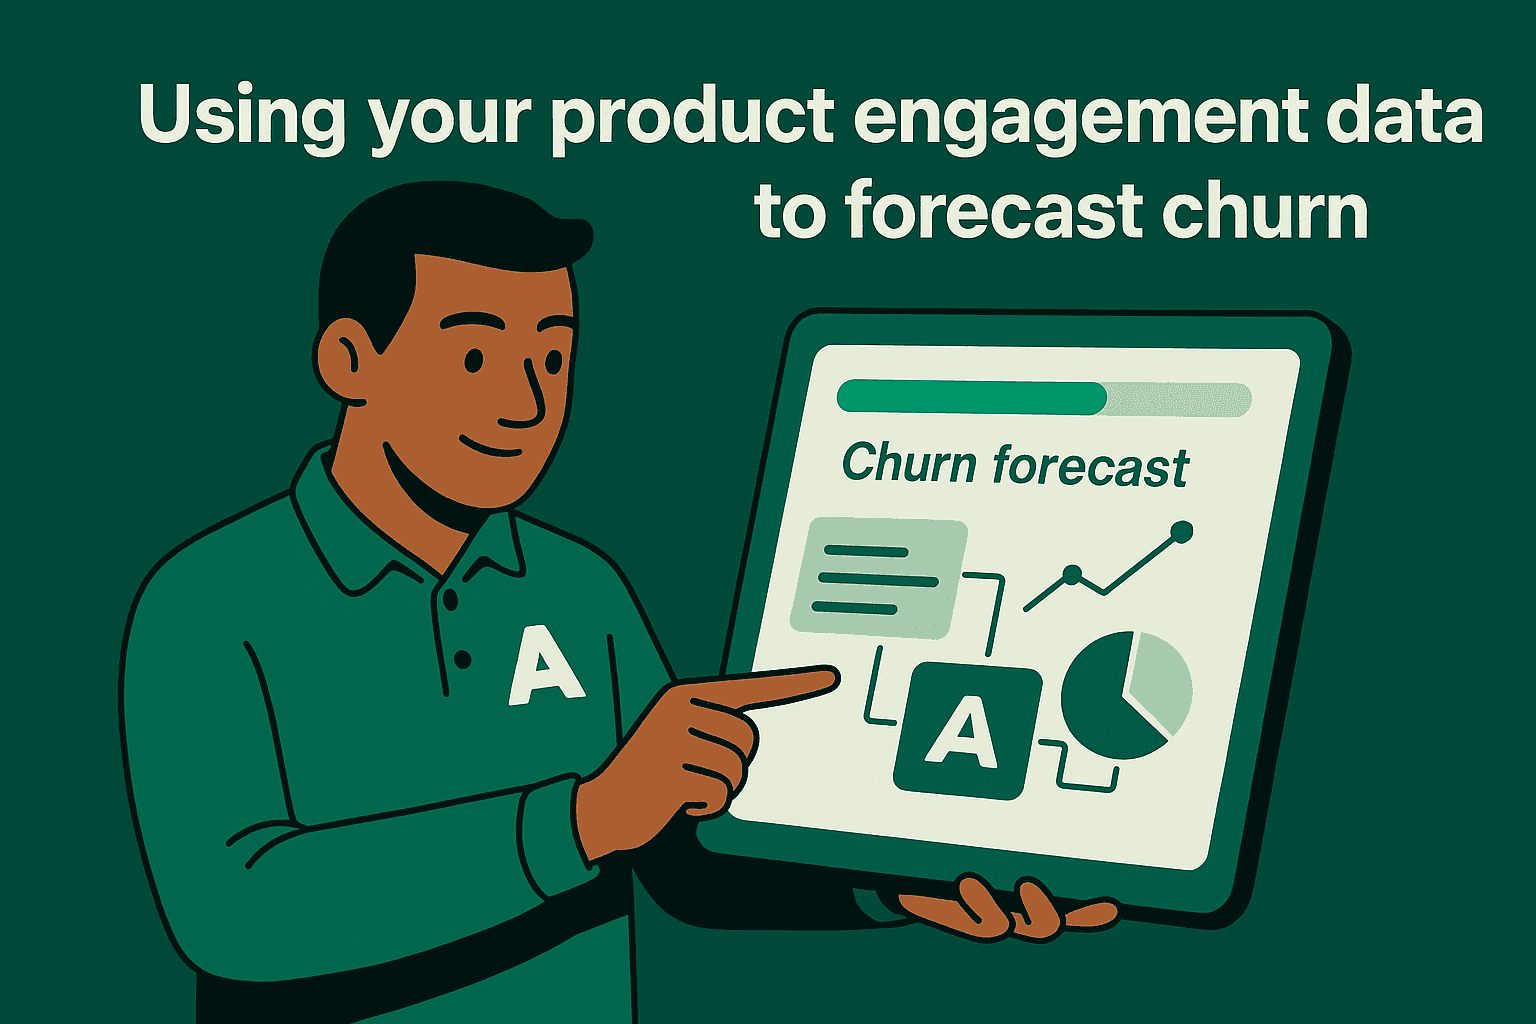
Stopping churn is the most powerful lever for survival, recovery and growth. Forecasting churn will give you clear visibility into revenue at risk.
Why we need a churn forecast
You already forecast sales every month. Yet most of us drag a fixed churn rate across a spreadsheet and call it a day. In normal times that might have worked. But in a crisis, churn can swing widely and surprise you.
Four steps to build a churn forecast
A solid churn forecast follows the same formula as a sales forecast: account size × chance of churn. The tricky part is figuring out that "chance of churn." Follow these four steps:
- Understand churn indicators
- Track these indicators closely
- Group accounts into risk cohorts and assign a churn likelihood
- Plug those likelihoods into your revenue model
Step One: Understand churn indicators
Churn shows up in your product engagement. Warning signs include:
- Low activation in the first weeks with your product.
- Consistently low engagement over time.
- Sudden drops in engagement.
- Complete inactivity for a set period.
- Farewell events like data export or removing integrations.
Step Two: Track these indicators
Tracking engagement can be tricky without the right tools. If you have an engagement-scoring system, use it. Otherwise, build simple scripts or dashboards that record activation and engagement for every paid account.
Step Three: Create risk cohorts
Group accounts by tenure and engagement risk. New users behave differently to long-term users. Assign each cohort a churn likelihood based on their activity patterns.
Step Four: Combine likelihoods with MRR
Multiply each account's monthly revenue by its churn likelihood. Then sum those figures to get your total forecasted churn. This gives you a clear number for revenue at risk.
Forecasting timeframes
You can forecast churn one month or three months ahead. Short windows give precise insights. Longer windows let trends emerge. Modeling both can balance accuracy and planning.
Annual contracts
If you only sell annual plans, apply the same model to contracts due for renewal in the next quarter. Remember that direct feedback near renewal may override your churn likelihood, so use the model as a guide.
Not an exact science
No forecast is perfect. But using real engagement data will make your model far more accurate. Start with a few months of historical data, test your predictions, then refine your cohorts and likelihoods. You'll soon wonder why you didn't do this sooner.