Last updated: June 2026
Chances are you're here because Amplitude isn't quite delivering the clarity or ROI you expected. Maybe pricing spiked the moment your trial ended. Maybe your customer success team keeps asking questions that the platform was never meant to answer. Or maybe every dashboard needs an analyst standing by to explain what you're looking at.
This guide breaks down how Amplitude stacks up against other analytics tools – and where it stops being the right fit, especially when B2B revenue is on the line.
Teams usually move on from Amplitude for the same reasons:
- Costs climb past $10,000 a year as data volumes grow.
- The learning curve slows down non-analysts who need fast answers, creating bottlenecks for leadership and GTM teams.
- Manual event tagging adds ongoing engineering work.
- No built-in customer success workflows for tracking account health, renewals, or churn risk.
Amplitude was built for product teams digging into user behavior, not leadership teams accountable for revenue performance and customer LTV. That distinction matters more than any feature checklist. In the end, the right tool depends on whether it helps you make faster, more confident decisions that protect and grow revenue.
What Amplitude does well and where it breaks
Amplitude pioneered digital analytics for product teams who needed more than Google Analytics could offer when it came to tracking in-app behavior. When it launched, product managers finally had a platform built for understanding what happens inside applications after users sign up – behavioral cohorts, funnel analysis, retention curves, and pathfinder visualizations that show how features actually perform.
For the right teams, it still delivers on that promise exceptionally well.
Where Amplitude wins
Product managers get tools designed specifically to understand feature adoption and user retention at scale. You can segment users by behavior, track conversion through multi-step funnels, pinpoint drop-off points in onboarding flows, and build cohorts based on complex action sequences. That level of depth helps turn raw usage data into informed product roadmap decisions.
Enterprise customers also gain access to predictive analytics, experimentation frameworks, and the kind of advanced analysis that supports six-figure annual contracts. If you're running multiple product lines across different user segments and need statistical rigor behind feature releases, Amplitude offers infrastructure that spreadsheets and simpler tools can't provide.
Why teams look for alternatives
The interface works well for analysts who live in behavioral data, but it can frustrate customer success managers who just want to know which accounts are healthy. Creating a useful dashboard means understanding events, properties, segmentation logic, and analysis types – skills product teams build over time, but CS teams rarely have the space to learn.
Event tracking also requires ongoing engineering effort. Every new feature, button, or interaction needs instrumentation. Launch a new workflow? Tracking has to be added. Redesign navigation? Event calls need updating. This work never really stops, and it competes directly with shipping product.
Finally, the platform assumes product analytics is a full-time focus, not one part of a broader customer health strategy. Amplitude answers "what are users doing in our product?" with impressive precision, but it doesn't turn that into "which B2B accounts need attention today," or trigger alerts when specific customers show risk signals. That gap matters when your responsibility is protecting revenue, not just improving features.
Understanding what type of analytics tool you need
Amplitude is a product analytics tool. If you're comparing it with Mixpanel, Heap, or PostHog, you're looking at the same category: platforms built to track user behavior inside your application. But if your real challenge is protecting B2B revenue or understanding marketing attribution, you're in the wrong aisle. That requires a different class of tool altogether.
These category differences matter more than any feature checklist. Pick the wrong one and you'll burn weeks on implementation, only to find your core questions still unanswered.
Product analytics: What happens inside your product
Amplitude, Mixpanel, Heap, and PostHog all answer the same basic question: how do users interact with your product? They track in-app behavior after signup – what gets clicked, which workflows are completed, and where users drop out of multi-step flows.
Product managers rely on these tools to understand feature adoption, spot friction, and analyze retention. When you need evidence to guide roadmap decisions – based on real usage rather than opinions – product analytics delivers it.
For feature optimization and product planning, Mixpanel, Heap, and PostHog do the same job as Amplitude, just with different implementation styles and pricing.
Web analytics: How people find you
Google Analytics 4 focuses on website traffic, marketing attribution, and campaign paths from ad click through to signup. This is acquisition analytics. It shows which channels drive visitors, how campaigns perform, and where traffic comes from geographically.
Marketing teams use web analytics to shape acquisition strategy. Product teams use product analytics to improve retention. Most B2B companies run both because they answer different questions for different teams. Google Analytics shows how users arrived; Amplitude shows what they did once they were in.
Customer analytics: Which B2B accounts will renew
Customer success teams need to spot at-risk accounts before renewal discussions begin. Product analytics tools were built to optimize features, not protect revenue, and that leaves a real gap for B2B companies.
High event volume doesn't guarantee renewal. An account might generate 20,000 events from three interns testing features, while the VP who signs the contract hasn't logged in for 90 days. Your dashboard looks healthy, engagement is green, and the account still churns because the decision-maker never saw value.
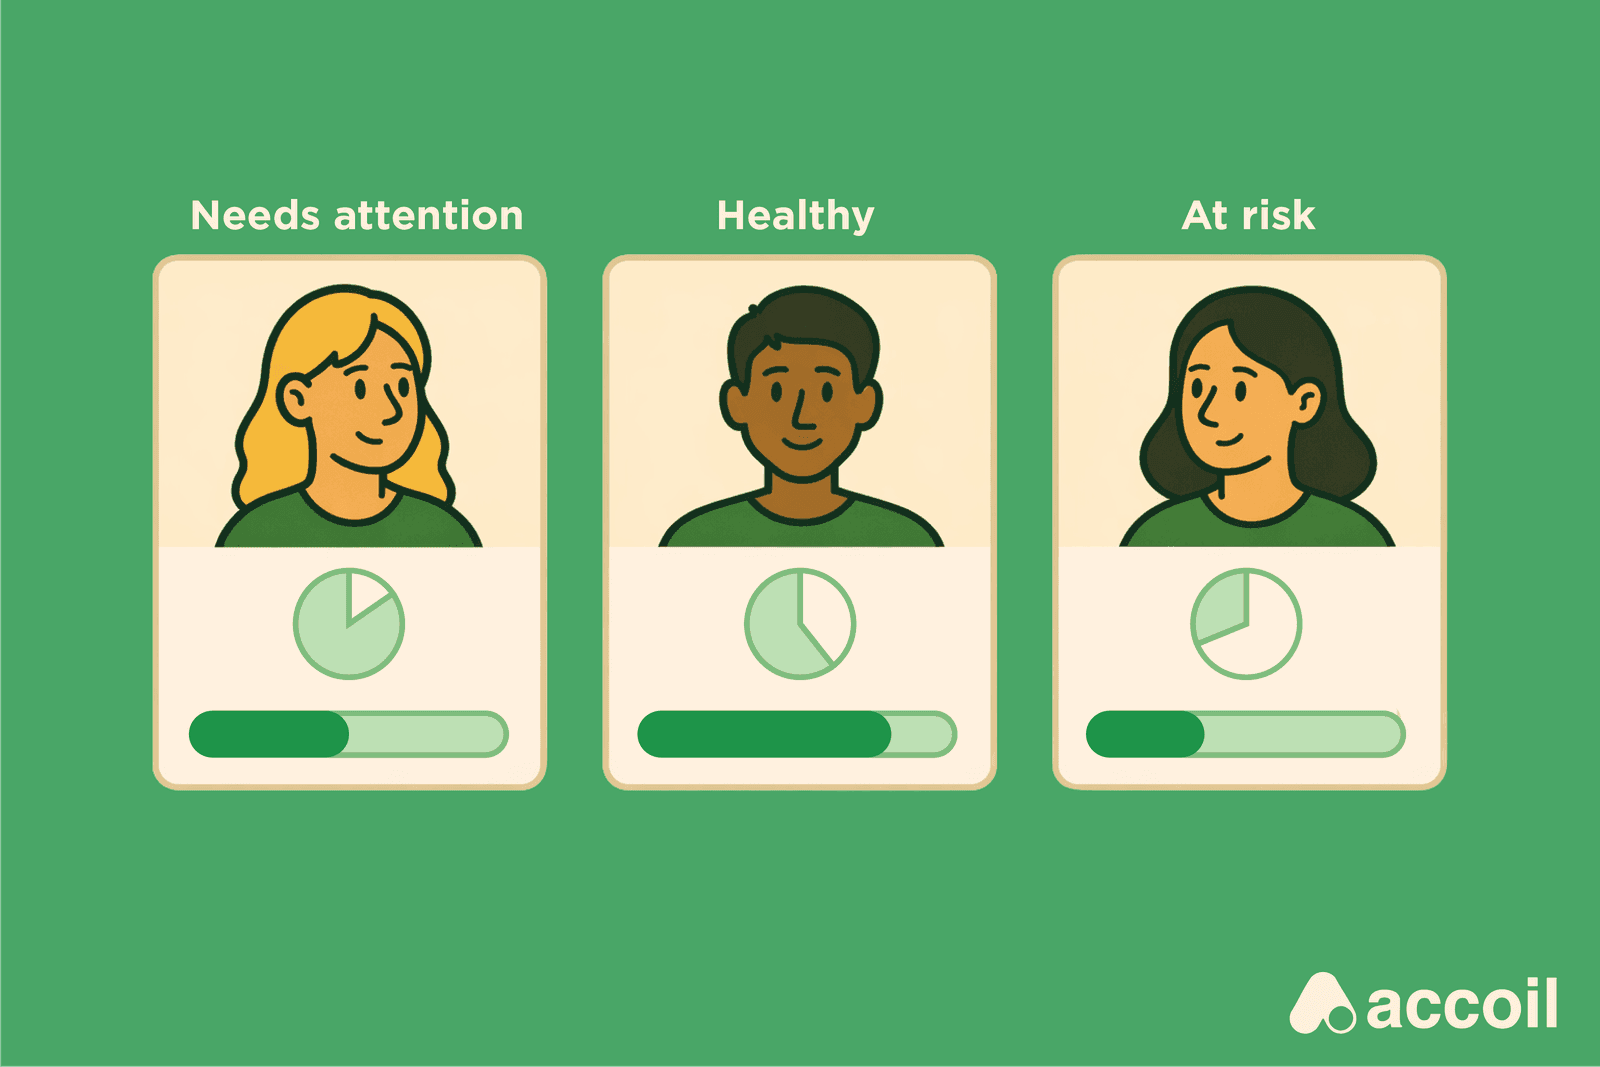
B2B businesses need account-level health signals, not individual click data. Customer analytics platforms like Accoil serve you in several important ways:
- They turn product usage into account health scores.
- They flag which customers need attention today, and why.
- And they send alerts straight into Slack and your CRM.
Whereas product analytics tools watch features for product teams, these tools watch accounts for revenue teams.
Is a product analytics tool really what you need?
If you came here searching for "Amplitude alternatives," start with a simpler question: are you trying to improve features, or protect revenue? That difference decides whether you should compare product analytics tools or look at a different category altogether.
You need another product analytics tool if:
- Your product team needs clearer funnel analysis, cohort segmentation, or retention tracking to guide roadmap decisions.
- You have analysts or engineers who can handle event instrumentation and maintain custom dashboards.
- Your main goal is understanding how users interact with the product so you can decide what to build next.
In that case, compare Amplitude with Mixpanel, Heap, and PostHog. Look closely at how events are captured (manual tagging vs. autocapture), how pricing works (user-based vs. event-based), and whether the tool matches your team's technical comfort level.
You need customer analytics if:
- Your customer success team needs early signals about which accounts are at risk before renewal conversations begin.
- Product usage data lives in dashboards that no one checks daily because they don't answer a simple question: who needs help today?
- Renewals keep catching you off guard, even though the warning signs were there in hindsight, just never surfaced in time to act.
Product analytics tells you what happened in the product. It doesn't tell you which accounts need attention right now. Customer analytics tools turn usage data into account health signals that CS teams can use – sending alerts to Slack, updating scores in your CRM, and flagging risk before it turns into churn.
Most B2B companies need both. Product analytics supports feature decisions. Customer analytics protects retention. They serve different teams and different jobs, and forcing one tool to cover both usually leaves important gaps.
Comparing product analytics tools
The choice between Amplitude alternatives comes down less to feature lists and more to how events are captured, how much engineering time you can spare, and what your team can realistically support day to day.
Manual tagging gives you clean, deliberate data, but it also means developers must instrument every new feature and keep dashboards up to date. Autocapture tracks everything by default, which removes setup work but introduces a governance problem when you're staring at thousands of unstructured events. Warehouse-native tools avoid data movement entirely, but they assume you have data engineers who are comfortable with SQL and maintaining data models.
This architectural choice affects setup time, ongoing maintenance, and total cost of ownership more than almost any individual feature. Before comparing platforms, it's worth being honest about what your team can handle in practice.
1. Mixpanel
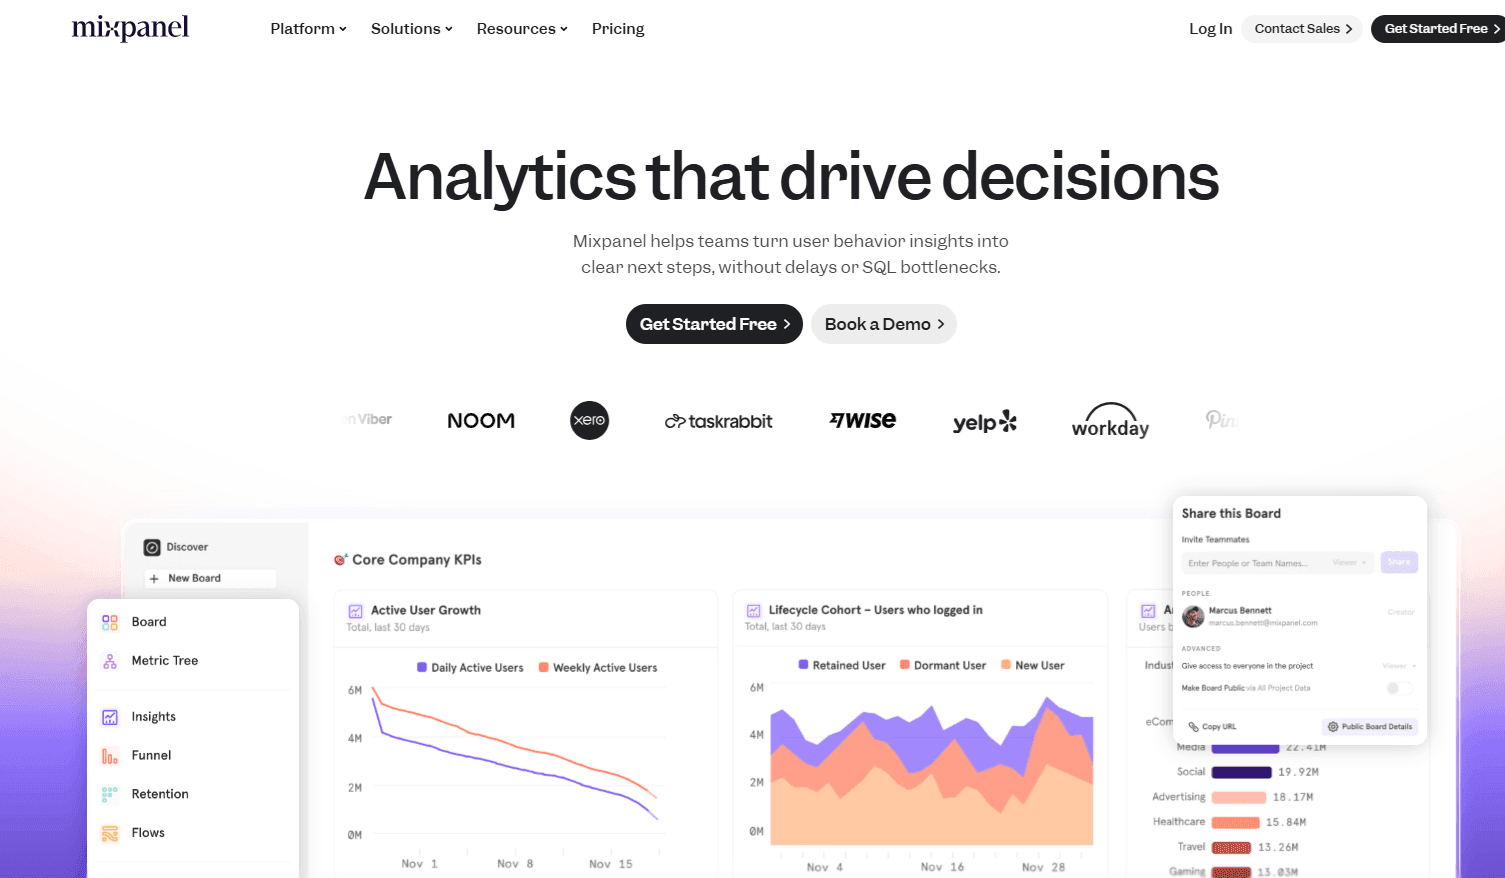
Mixpanel delivers behavioral analysis and cohort segmentation on par with Amplitude. Funnels, retention curves, behavioral cohorts, and user journey analysis are all there, and the level of analytical depth is genuinely comparable, as is the workload.
You still commit to manual event tagging and ongoing dashboard upkeep. Switching tools doesn't remove the engineering effort. Mixpanel makes sense if its pricing fits your data volume better, if your team prefers its dashboard UI, not because it offers meaningfully stronger analytics than Amplitude.
Neither Mixpanel nor Amplitude is objectively superior. Both rely on manual tagging and both support deep behavioral analysis. The decision usually comes down to secondary factors: pricing at your scale, which interface your team finds easier to use, or whether integrated messaging simplifies your stack.
2. Heap
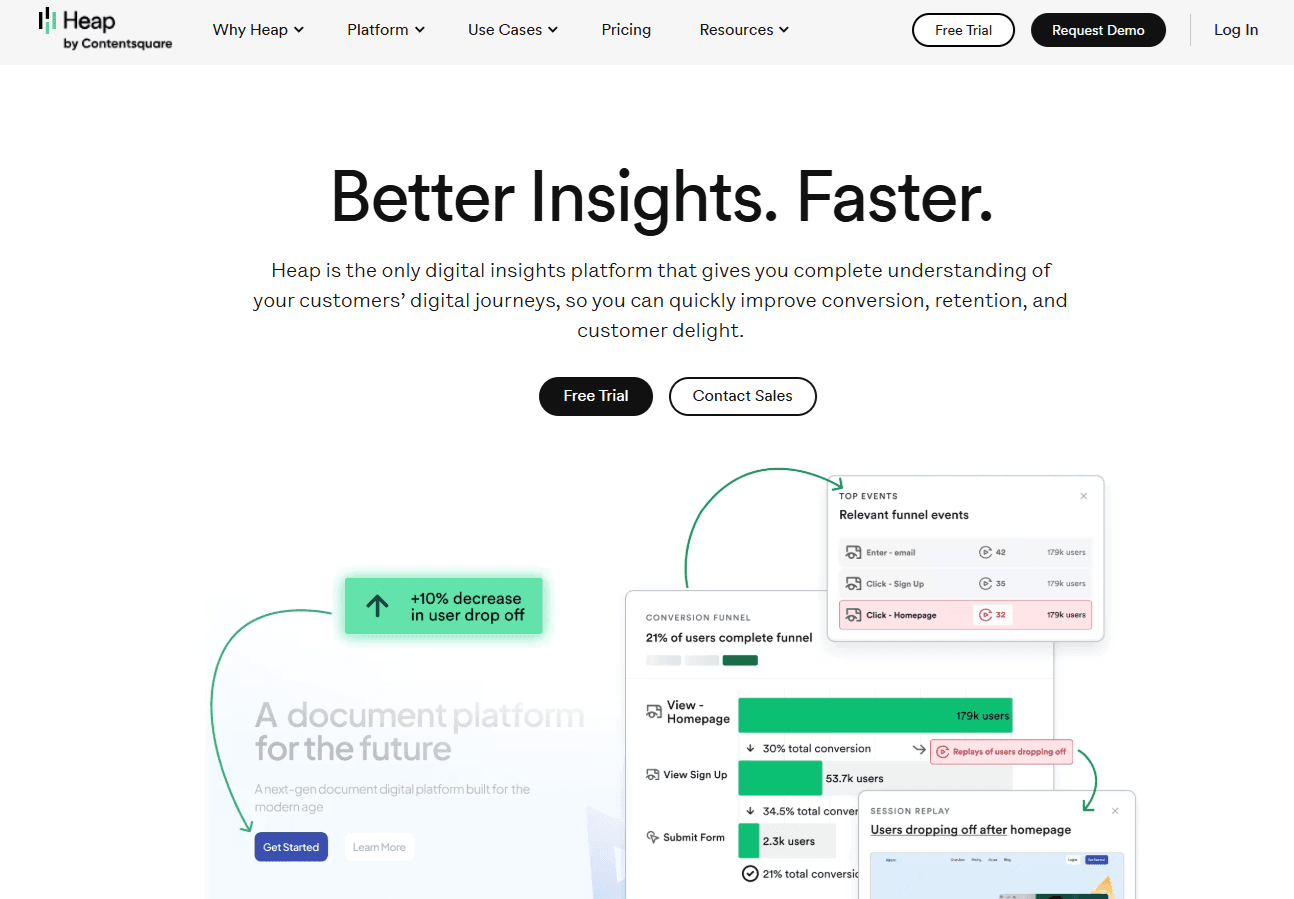
Heap (now part of Contentsquare) automatically captures all user interactions, removing the need for developers to instrument events. Ship a new feature, and Heap is already tracking clicks, form submissions, and page views. This also enables retroactive analysis: you can define an event today and analyze past behavior because the data was captured from the start.
The downside shows up later. Without strong data governance, teams can end up buried under thousands of auto-captured events that were never planned for or consistently named. For teams without disciplined data practices, analysis can become harder rather than easier.
Heap best fits marketing and e-commerce teams with limited engineering capacity that need digital experience tracking and can't afford ongoing instrumentation work. Heap's model works especially well for website behavior, less so for complex application workflows.
3. PostHog
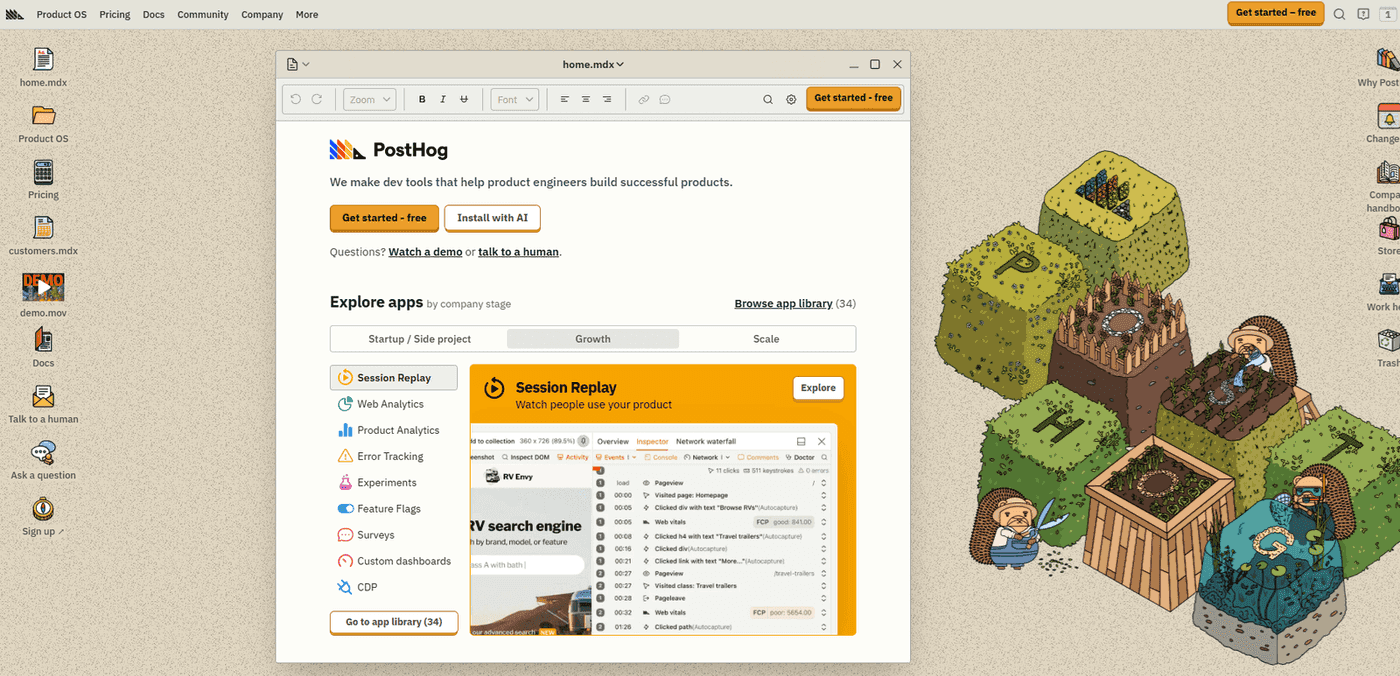
PostHog combines product analytics, session replay, feature flags, and A/B testing in a single open-source platform. Instead of paying separately for tools like Amplitude, LaunchDarkly, and FullStory, you get those capabilities together. Its open-source design and self-hosting options appeal to teams that want full control over their data and infrastructure.
This consolidation meaningfully reduces tool sprawl. There are fewer vendors to manage, fewer integrations to maintain, and one place where product teams can analyze usage, review session replays, run experiments, and control feature rollouts.
This works great for engineering-led teams that are comfortable managing infrastructure and value vendor independence over quick setup. If you already run your own systems and want to keep data inside your environment, PostHog's self-hosted option delivers that control. Its generous free tier also makes it a practical starting point for startups new to product analytics.
4. Budget options with honest tradeoffs
PostHog's free tier is generous enough to support early-stage companies. Mixpanel offers free usage up to 100,000 monthly tracked users, which covers many growing startups. Google Analytics 4 is entirely free with no user limits, though it's built for web analytics rather than in-app product tracking.
For teams with strict privacy requirements, especially in European markets, Matomo provides privacy-focused analytics with full data ownership and built-in GDPR compliance. It's available as a self-hosted option, where you control everything, or as a cloud service where Matomo runs the infrastructure but you still own the data.
The tradeoff with free and open-source tools is straightforward: you save money but spend more time. Setup is slower, documentation can be uneven, features are narrower, and community support replaces dedicated customer success teams. For bootstrapped startups, that's often acceptable. For funded companies protecting revenue, paying for a mature platform can be cheaper than the engineering time spent making free tools behave.
5. Accoil
Accoil is about renewal predictability, churn risk, and cleaner forecasting – not more dashboards. It helps reduce last-minute firefighting by turning raw product usage into clear, account-level health signals that show which customers are stable, which are drifting, and which need action now. The result is better NRR visibility (Net Revenue Retention), fewer surprises at renewal, and more efficient use of customer success time.
Rather than replacing your analytics stack, Accoil sits on top of it. It pulls data from tools like Amplitude, PostHog, and Segment, giving CS teams access to product signals without building event tracking, learning complex analytics interfaces, or waiting on custom dashboards.
Those signals are pushed directly into the systems teams that already run the business from. Account health scores appear in Salesforce and HubSpot, and alerts get sent to Slack when specific accounts show risk signals. Plus Accoil includes no-code automation so CS managers can set monitoring rules without filing engineering tickets or SQL skills. Starting at $50 per month with account-based pricing, it's built for B2B SaaS teams focused on customer health and retention, not feature-level product optimization.
Quick comparison by key differences
Use this table to compare tools on the dimensions that matter most for your team's situation and constraints:
| Dimension | Amplitude | Mixpanel | Heap | PostHog | Accoil |
|---|---|---|---|---|---|
| Data Capture | Manual tagging | Manual tagging | Autocapture | Manual + Autocapture | Reads from existing tools |
| Primary User | Product managers, analysts | Product managers, analysts | Product/marketing teams | Engineers, product managers | Customer success, account managers |
| Core Job | Feature optimization, user journey analysis | Behavioral analysis, messaging | Digital experience tracking | All-in-one product stack | B2B account monitoring |
| Pricing Model | MTU (user-based) | MTU (user-based) | MTU (user-based) | MTU or events-based | MAA (account-based) |
| Account-Level Analytics | Paid add-on (5 group limit) | Available with configuration | Available with configuration | Available via groups | Native foundation |
| CRM Integration | Limited | Limited | Limited | Limited | Native (Salesforce, HubSpot) |
| Slack Alerts | Manual setup required | Manual setup required | Manual setup required | Available | Native with no-code config |
| Free Tier | 50k MTUs | 100k MTUs | 10k sessions | Generous limits | 30-day trial |
| Best For | Teams with analysts needing deep product insights | Similar to Amplitude with different UX | Marketing/e-commerce teams without eng resources | Technical teams wanting one platform | B2B CS teams needing account signals |
MTU = Monthly Tracked Users, MAA = Monthly Active Accounts.
How Accoil fixes the customer analytics problem
Accoil doesn't replace Amplitude, Mixpanel, or PostHog; it connects to them and converts product data into clear, account-level signals your customer success team can act on.
Turns product data into account signals
Accoil converts product usage into weighted health scores (0–100) that customer success managers can understand without analyst support. Instead of asking, "Did users click the export button 47 times this week?", CS teams see, "Account ABC's health score dropped 15 points, indicating disengagement."
Built by founders who missed early churn signals at ThinkTilt (acquired by Atlassian) because product data never reached CS teams in a usable form, Accoil highlights which specific accounts need attention today based on engagement patterns and usage trends.
It's designed for B2B SaaS companies with roughly 10–100 employees and $1–20M in revenue; teams that find enterprise customer success platforms overpriced, but outgrow spreadsheets quickly.
Ultimately, what's better than Amplitude depends on your role. For product analytics, Mixpanel offers similar depth with different pricing. For B2B customer analytics, Accoil turns product data into account-level signals that drive real CS conversations.
Reads data from your existing tools
Accoil pulls data directly from Amplitude, PostHog, Segment, and RudderStack, with no need to rebuild event tracking. Setup takes minutes to hours: you simply add Accoil as another destination in your existing data pipeline.
Pricing is account-based and fits B2B economics. You pay per Monthly Active Account, not per user. Add 20 users to one account, and Accoil's pricing doesn't change.
User-based tools typically increase pricing as you add users, even when they all belong to the same customer account.
Pushes insights where teams work
Accoil updates scores in Salesforce and HubSpot, delivering a daily risk and growth feed into Slack and surfacing next-best actions directly inside your CRM or CSP, removing the need for daily dashboard checks. With no-code setup, CS managers can create monitoring rules without engineering tickets or SQL skills.
Seven opinionated metrics keep teams focused on signals that predict churn and expansion, rather than managing hundreds of custom events. This addresses the pull-analytics problem: insights sitting in dashboards no one checks until it's already too late.
Match your tool to your team's job
By now, it should be clear that Amplitude alternatives generally fall into three groups:
- Product analytics for feature optimization.
- Web analytics for acquisition tracking.
- Customer analytics for revenue protection.
The next decision is practical: which job matters most over the next 6–12 months.
If your product team needs deeper funnel analysis, compare Mixpanel, Heap, and PostHog, paying close attention to how they capture events and how pricing scales. If your marketing team needs reliable traffic attribution, Google Analytics 4 remains the right tool. But if your customer success team needs early warnings about at-risk accounts, that's a customer analytics problem, not a product analytics one.
Most B2B SaaS companies don't pick just one. They typically use multiple categories together: product analytics to guide what gets built, and customer analytics to protect recurring revenue.
If customer analytics is the gap in your stack, try Accoil today. You can plug it into your existing tools and get results within 24 hours to know which accounts are healthy, which are showing risk signals, and where your next renewal conversations should start.