Last updated: June 2026
Your Mixpanel bill shot up 40% last month after a spike in event volume. Or maybe your customer success team is still stuck exporting usage data into spreadsheets every Monday, just to figure out which accounts need help. Either way, something's off, and the fix depends on what problem you're really solving for.
Most teams looking for alternatives fall into one of two groups. The first wants better product analytics: tools with lower pricing, easier event tracking, and the ability to look back at data retroactively. The second group is using the wrong type of tool without realizing it.
If your CS team is piecing together dashboards just to guess how healthy an account is, a new analytics platform won't help. What you actually need is a customer engagement intelligence tool – something built to give your team clear, usable signals in the places they already work.
This guide breaks down what Mixpanel gets right, where it causes friction for B2B teams, and four solid alternatives – including what they really cost as you grow. We'll also look at when a customer analytics platform like Accoil can solve the kinds of problems that product analytics tools were never built to handle.
What Mixpanel does
Mixpanel is a product analytics tool that helps you track exactly how users interact with your product. Every click, scroll, and tap gets logged, so teams can pinpoint where people drop off in signup flows, see which features actually get used, and compare how different user segments behave. It's especially useful once someone has already signed up; this is where Mixpanel gives you real insight into what users do next.
Google Analytics, on the other hand, is better for tracking how people arrive at your site in the first place.
Mixpanel really proves its worth when you want to analyze user cohorts or build detailed behavior-based segments. For example, product teams might want to know what percentage of trial users activated a certain feature in their first week, or which version of an onboarding flow performs better, especially when comparing enterprise users to SMBs.
Popular alternatives to Mixpanel include Amplitude, Heap, and PostHog, but B2B teams with a focus on account health rather than individual user actions typically look for tools like Accoil instead.
Teams usually start looking for alternatives when they hit pain points: high costs from tracking lots of events, too much engineering time spent setting up tracking manually, dashboards that are too complex for non-analysts, or a need for account-level insights that Mixpanel doesn't offer.
Where it creates friction for B2B teams
Manual event tracking eats up time. Developers need to write custom code for every feature you want to monitor. That's easily 10–20 hours of engineering effort each month. And with group analytics, the setup has to be exact – miss a tag, and that data is gone for good.
Mixpanel focuses on individual user IDs, but that's a problem in B2B. Out of the box, Mixpanel treats user_123 and user_456 as equal - it doesn't inherently care who has buying power versus who just clicks around. So your customer success managers end up pulling Mixpanel reports, cross-referencing Stripe revenue, matching Salesforce contacts, and stitching it all together in spreadsheets just to figure out which accounts are actually doing well.
Signs Mixpanel isn't working for your team
Accounts marked as "healthy" still churn – because 40 people were logging in, but no one noticed your main champion quit three weeks ago. Your CS team can't tell which three accounts need a check-in without building a new custom report every time.
And sales? They need real signals sent straight to Slack and Salesforce, not buried in dashboards that require logins and filters. On top of that, you're charged for system events like auto-saves and API calls – things no one even looks at – while your bill keeps climbing.
Four product analytics alternatives
The product analytics space breaks down into a few key trade-offs: depth vs speed, flexibility vs ease of use, all-in-one platforms vs focused tools. Below, we've broken down four leading options based on what really matters – setup time, actual costs once you're scaling, and whether your team can use them without needing a dedicated data analyst.
Amplitude for enterprise-scale behavioral analytics
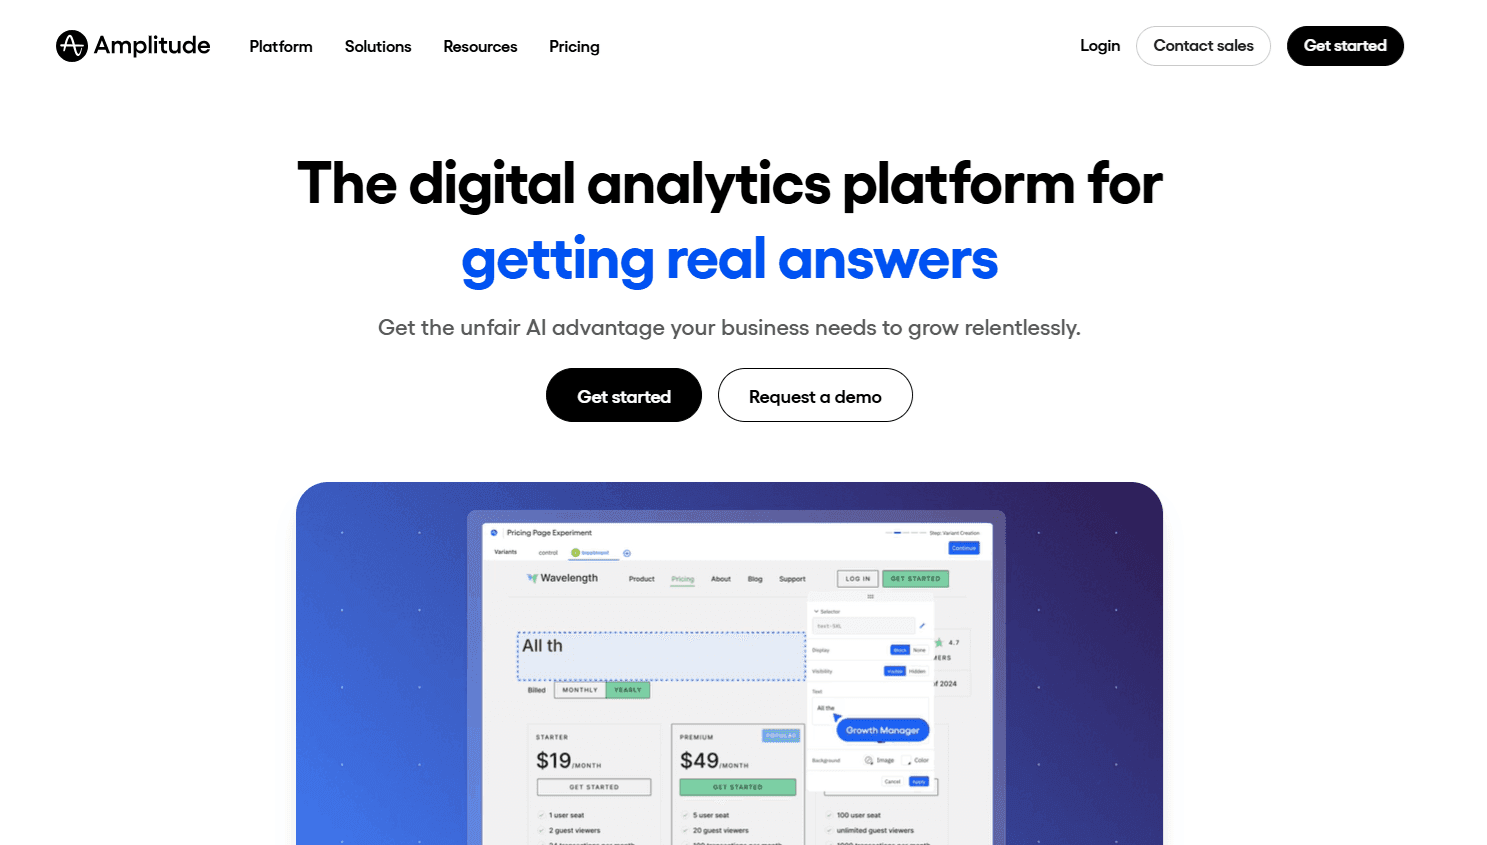
Amplitude gives you deep product analytics, similar to Mixpanel, but with better tools for behavioral cohorting and some predictive AI features woven in. It's built for teams that have analysts on staff and want to dive deep into user behavior – tracking patterns, segmenting cohorts, answering complex questions.
If all you care about is whether more people finished sign-up this week, Amplitude is probably more than you need. It's priced based on event volume, so costs can spike fast with high usage – especially if you don't filter out non-essential events. At scale, you're likely looking at $2,000–5,000 per month once you pass 1M monthly events. Pricing isn't always transparent either, so factor in time for quote-hunting.
Heap for automatic event capture without manual tagging
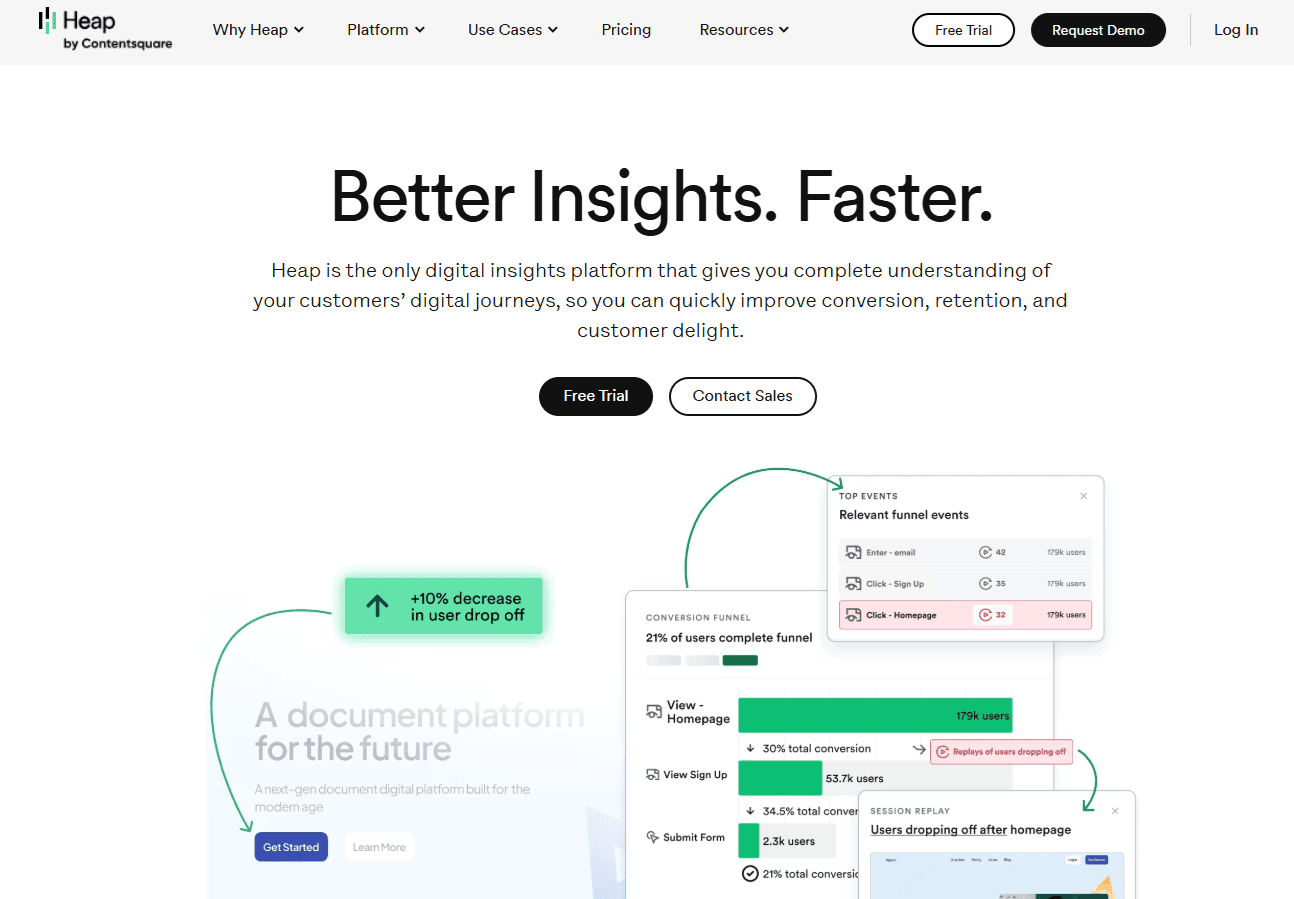
Heap tracks everything users do in your product – clicks, form submissions, page views – without needing your developers to manually tag each event. That means if your PM decides last week's new feature should've had button tracking, they can retroactively define that event and immediately analyze past user behavior.
It cuts out the cycle of tagging, waiting for data, then realizing you tracked the wrong thing. PMs and product teams can dig into questions themselves, without waiting on an engineering sprint. Heap's Starter Plan is especially useful for early-stage teams without analytics engineers. Just note that while its automatic tracking is powerful, its integrations and ecosystem aren't as broad as Mixpanel's.
PostHog for consolidated analytics with open-source flexibility
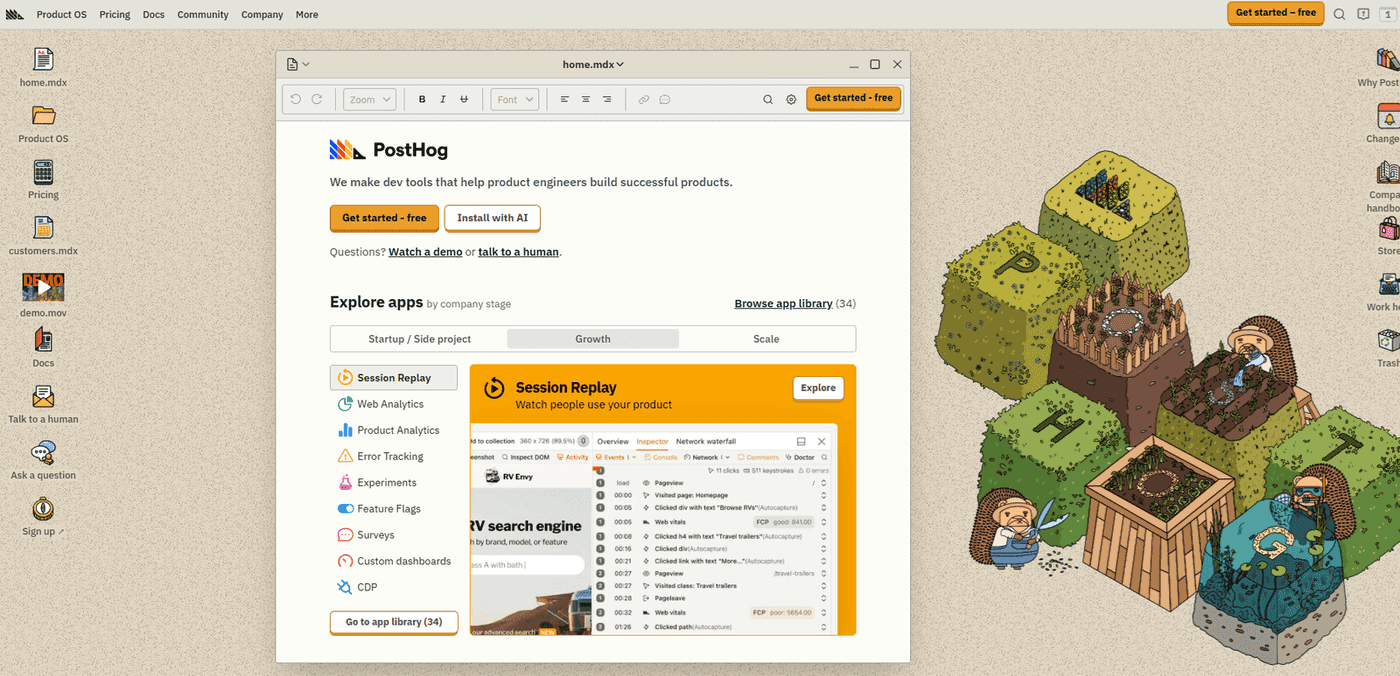
PostHog is an open-source tool that bundles product analytics, session replay, feature flags, and A/B testing into one platform. That means fewer tools to manage – and a solid free tier for up to 1M monthly events. You can also self-host it, which is useful if your team has strict data compliance requirements or needs full control over infrastructure.
But self-hosting isn't free in practice. You'll trade a SaaS subscription for ongoing cloud costs – usually around $500/month – and engineering time for setup, updates, and server maintenance. It adds up. So be honest about your team's bandwidth. For teams led by engineers looking to simplify their stack, PostHog can be a great fit. For less technical teams, the interface is more demanding than something like Mixpanel.
Hotjar for understanding why users behave certain ways
Hotjar helps you understand user behavior through session recordings, heatmaps, and surveys. It's not a product analytics tool on its own – it's a way to layer in the context behind the numbers.
If your data tells you sign-ups dropped 15% last week, Hotjar can show you the real story: users clicking a confusing button five times before giving up. You won't see that in Mixpanel. Use Hotjar to uncover the "why" behind user behavior, while other analytics tools tell you "what" happened. It works best as a complement, not a replacement.
How to choose between product and customer analytics
The tools in this guide solve two different problems. Mix them up, and you won't just waste time, you'll waste serious money. Choosing the wrong category costs more than picking the wrong vendor within the right one.
Say you're a product manager trying to figure out why signups dropped 20% last week. You'll want product analytics to trace behavior trends, funnel leaks, and test results. But your customer success team? They need to know which accounts are likely to churn, and which are ready to expand. That's customer health. The best tools here push action lists straight into Slack or your CRM so you don't need to write SQL.
Product analytics gives you charts. Analysts dig through them for patterns. Customer analytics tools surface the signals for you – "VP hasn't logged in for 30 days, usage down 40%, renewal due in 60." The difference matters. Optimizing a product and retaining revenue rely on the same data, but they need different outputs. That's why most teams end up needing both.
Team size and budget considerations
If your team's under 20 people, start simple. PostHog's free plan or Heap's autocapture will save you a ton of engineering time. Every month your developer spends two days maintaining tracking code, that's $10K–$15K a year in wasted salary. Most tools cost far less than that.
Be careful with pricing models. Event-based billing charges you for background noise – automated system events no one ever looks at. Account-based pricing grows with your actual customer base, not technical fluff. And if you don't have in-house analysts, go for tools with built-in metrics over fully flexible ones. Customization you can't use just adds confusion.
Implementation speed and technical fit
Autocapture tools like Heap or PostHog start delivering insights in days – not the weeks it takes to tag every button and screen manually. If you're using a pipeline like Segment, you can stream events into multiple tools at once without doubling your engineering work or juggling SDKs.
Self-hosted options might save you on subscriptions, but they'll cost you in maintenance – think ops load, downtime, and scaling issues. The fastest setups are the ones that plug into what you've already got. Connecting to your Segment or RudderStack pipeline in under 24 hours beats spending months rolling out a brand-new SDK.
Workflow integration requirements
If your sales team needs to know which trial users are hot and ready, pick a tool with native Salesforce sync. If your support team should see customer risk levels during ticket handling, you need integrations that bring health signals into the helpdesk – so they don't accidentally escalate a low-impact bug for a high-risk customer.
The best tools push alerts to Slack and CRM platforms automatically. No one should have to dig through dashboards or build queries daily. And when time matters, prebuilt segments are better than endless customization. You don't need flexibility – you need answers.
If your real challenge isn't "how do we improve funnels" but "which accounts need help right now," you're not looking for product analytics. You're in customer analytics territory – and that's where a tool like Accoil is built to do the job properly, instead of stretching a product analytics tool past its limits.
Why Accoil is the best alternative for customer analytics
If your Mondays start with a spreadsheet dump, health scores showing "healthy" accounts that still end up churning, and nobody knowing which three customers to call first, you don't need another dashboard. You need a tool that flags the accounts needing attention today—and delivers that info straight into the tools your team actually uses.
That matters even more for B2B platforms and marketplaces. Companies like Shopify and BigCommerce use Accoil to track merchant accounts, not individual shoppers. The goal isn't to analyze end-user behavior—it's to spot which business customers are likely to leave, figure out why, and get that insight into the hands of someone who can act on it.
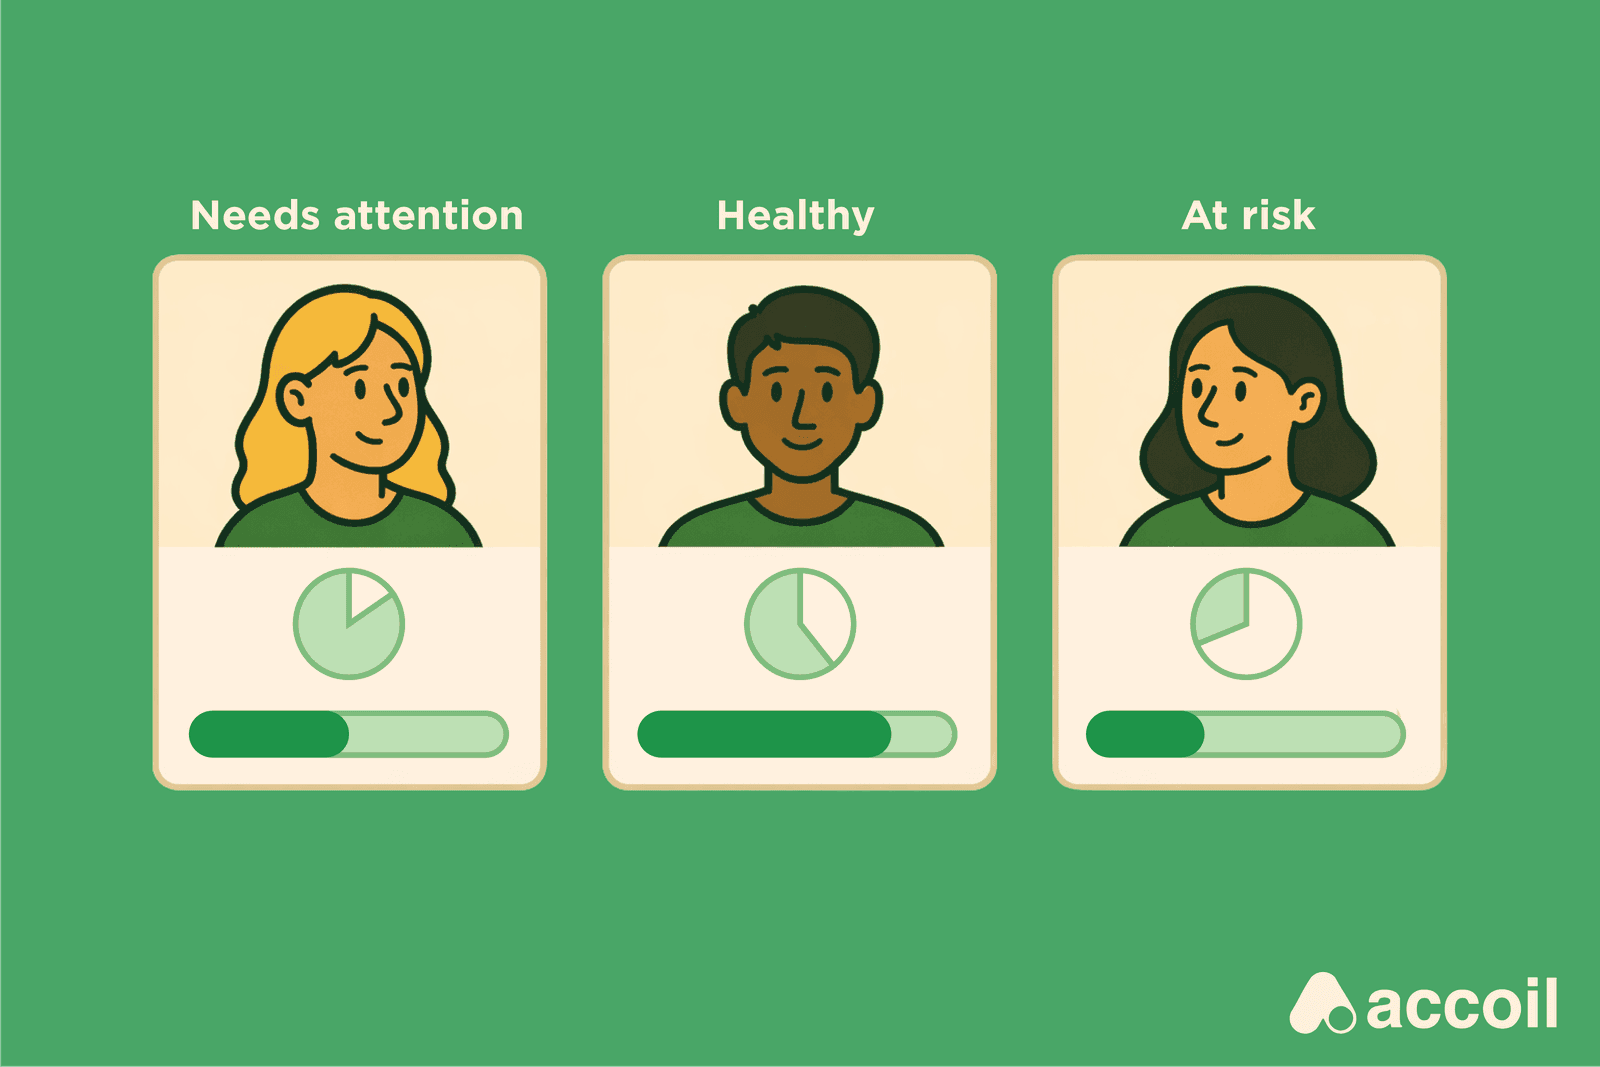
How Accoil delivers explainable account health
Accoil turns product usage into clear, actionable health scores – so you can see which accounts need attention, and why. If the VP at ACME Corp stops logging in but 40 others stay active, Mixpanel still shows a healthy account based on user volume. Accoil spots that the key decision-maker's been inactive for 30 days and sends a Slack alert before you miss the renewal window.
It comes with pre-built segments using opinionated metrics – like frequency, stickiness, and feature adoption – so you're not stuck learning SQL or waiting on analysts.
That means no dashboards to interpret – Accoil is built for GTM teams, not data teams. AI-generated account summaries explain what's happening inside each account, why it matters, and what your team could do next – every score includes a reason, not just a number. That way, your CSM knows whether to reach out about an inactive VP, poor feature adoption, or shrinking engagement.
Built for speed by people who lived the pain
The team behind Accoil built ThinkTilt, which was acquired by Atlassian in 2021. They've lived the pain of bending product analytics tools into CS workflows that need completely different outcomes. That's why Accoil connects to Segment, RudderStack, or PostHog in under a day.
It sends alerts to Slack, Hubspot, Intercom and Salesforce, where your team already works, so there's no need for daily dashboard check-ins. Pricing starts at $50 a month and scales with your number of customers – not your event volume – so you're not punished for growing product usage.
Who Accoil serves best
Accoil is built for B2B SaaS teams under 50 people, usually earning between $1M–$20M, who need fast visibility into account health without the hassle of a long rollout or enterprise-grade complexity. If your CS team is exporting data from Mixpanel, merging it with Salesforce, and manually scoring accounts every week, you'll see value fast.
Revenue leaders who want alerts about churn risks – minus an additional dashboard to log into – get the signal they need without hiring analysts. And platform providers looking to track which business customers need help get exactly the kind of account-level monitoring other analytics tools can't provide.
If you want clearer signals and fewer surprises, start a free trial with Accoil and see how quickly it surfaces what other tools miss.