
The dashboard that goes from score to signal
Every account's score, activation, and momentum in one live view, connected to the signal that says who to act on.
Live on your own data in under 24 hours.
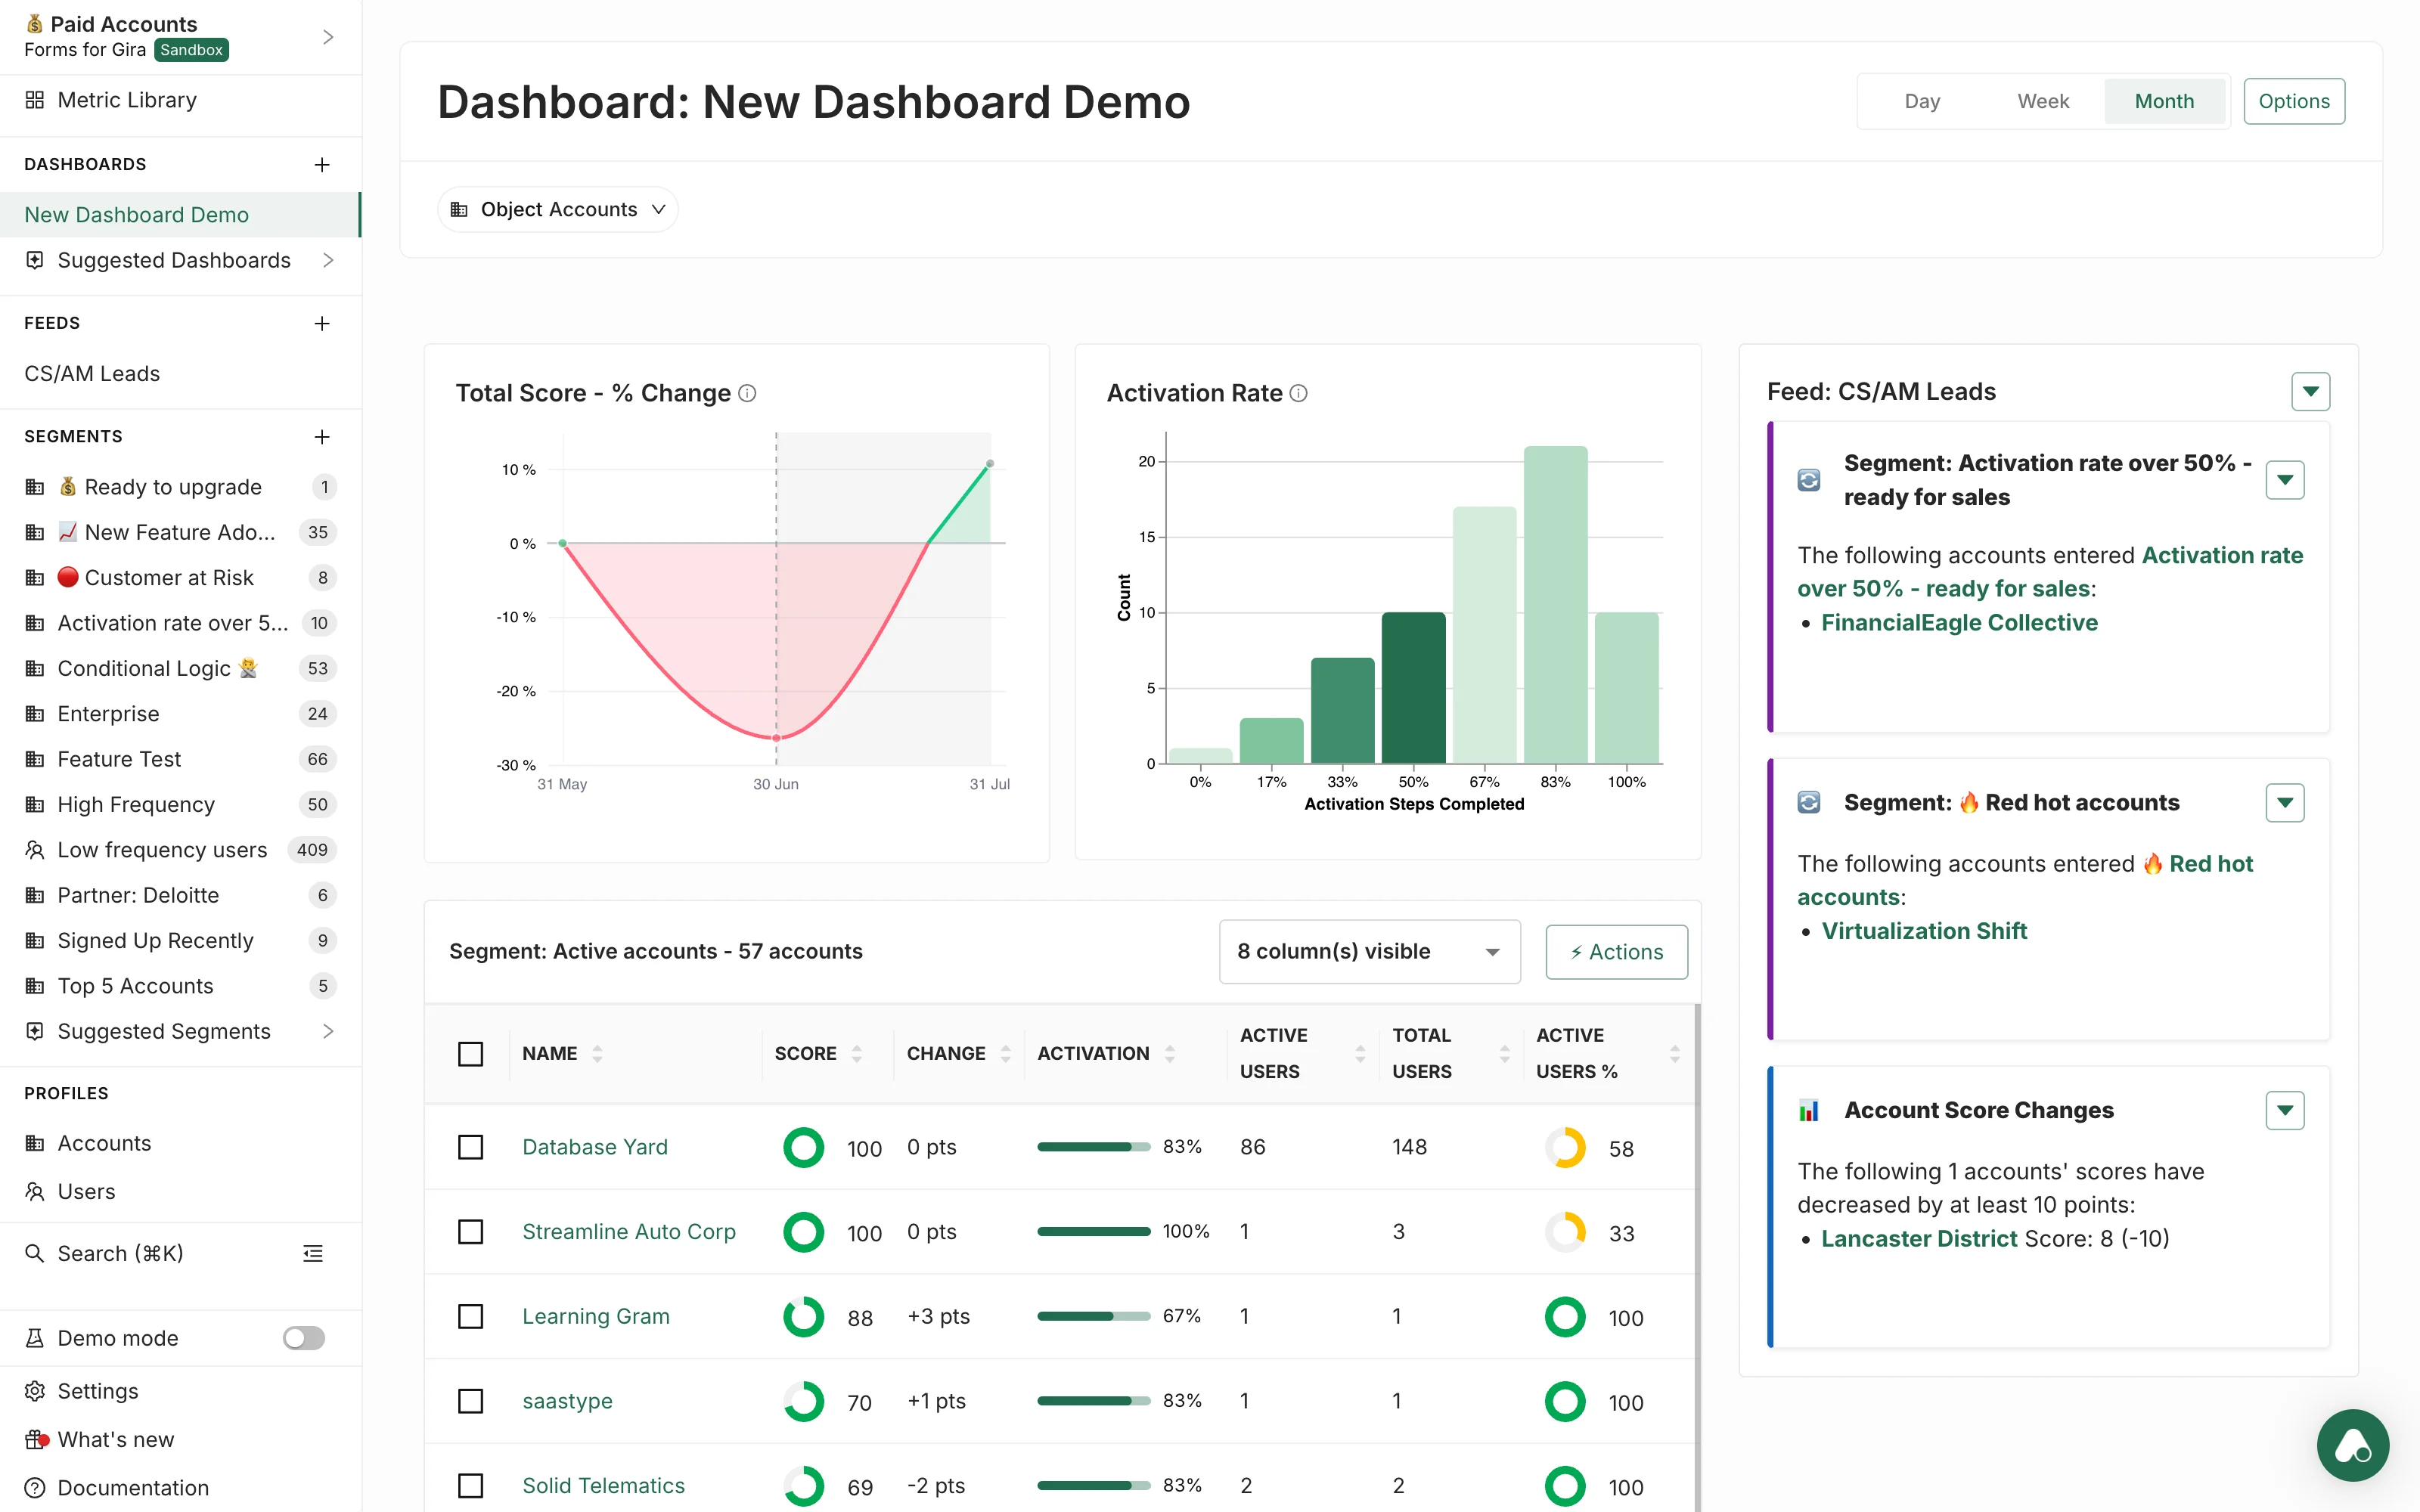
Most dashboards are a wall of charts nobody opens.
You already have the numbers: in a BI tool, a Customer Data Platform (CDP), or a dashboard one person built. The gap is a view built around the decision: what changed, what it means, and what to do next.
- Get clear answers first, with the charts behind them
- Know the moment a key metric changes, when it's time to act
- One shared read, the same data and explanation for everyone
- Your next-best action suggested, in the tools you use

Turns these metrics into signals in the tools you already use, so your team knows what to do next.
Kernfunktionen
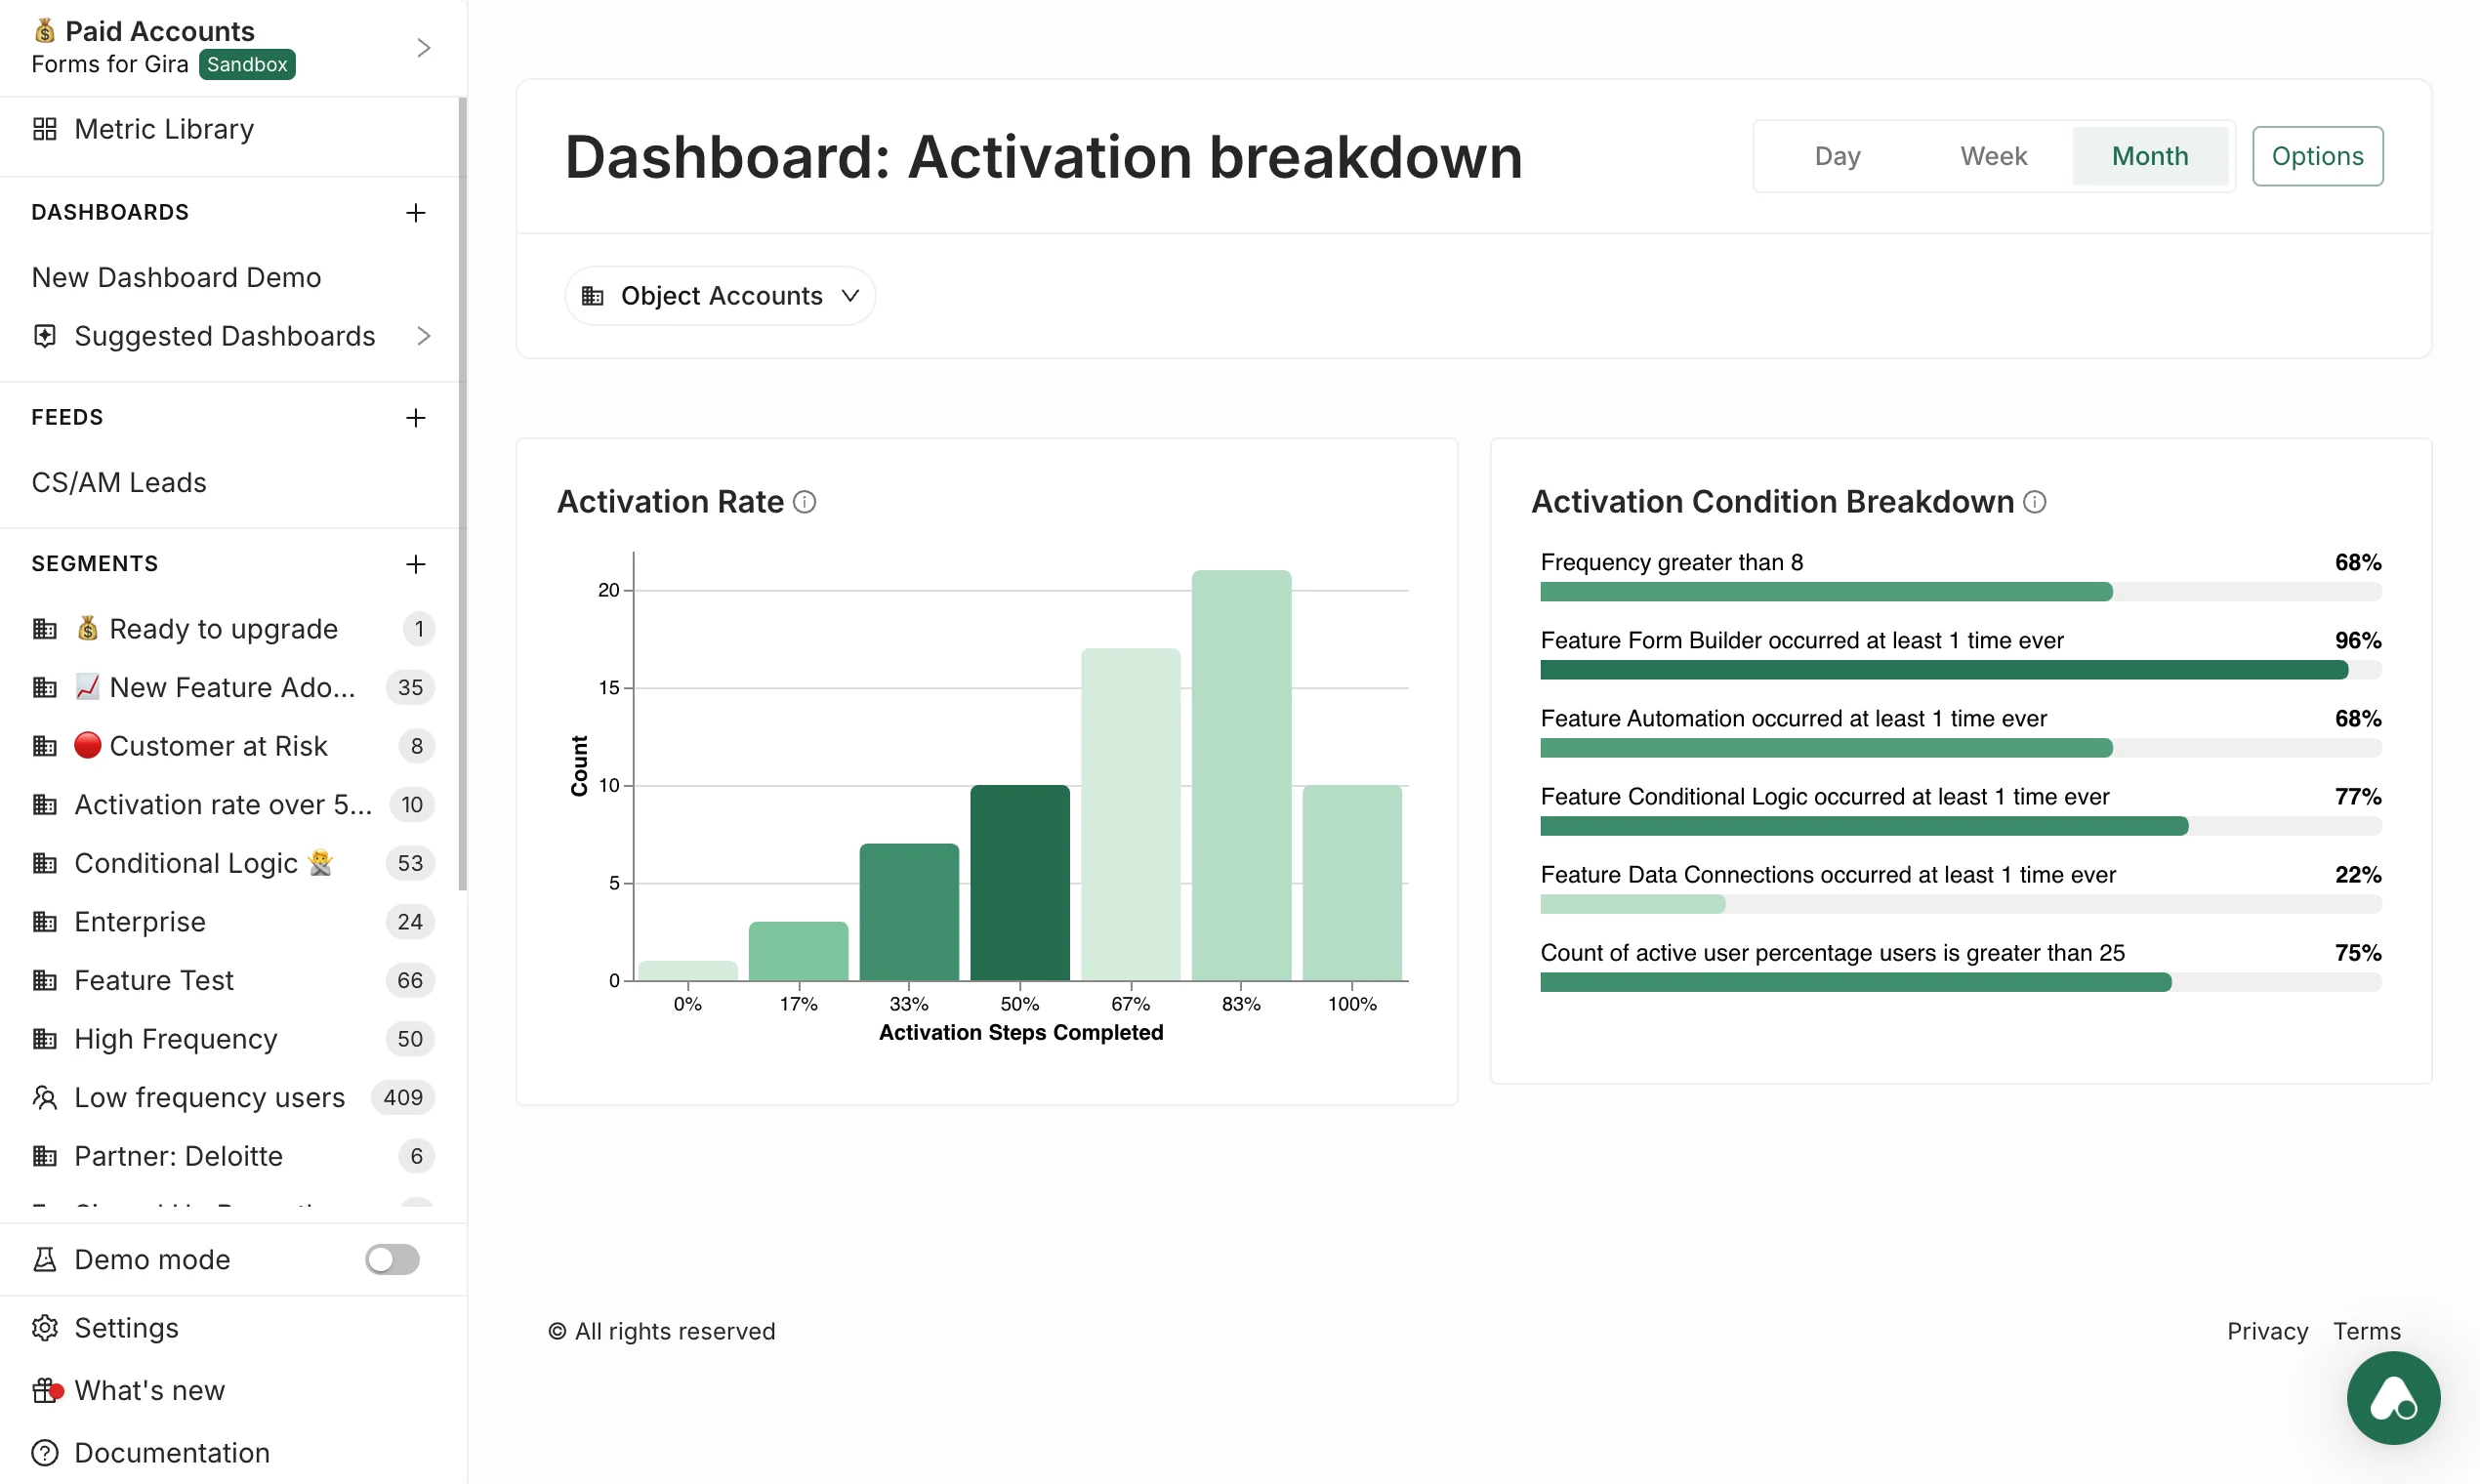
Activation Rate & Condition Breakdown
Usage volume isn't health. The dashboard leads with Activation Rate: the value-steps each account has reached, and the ones it hasn't. These numbers move before revenue does.
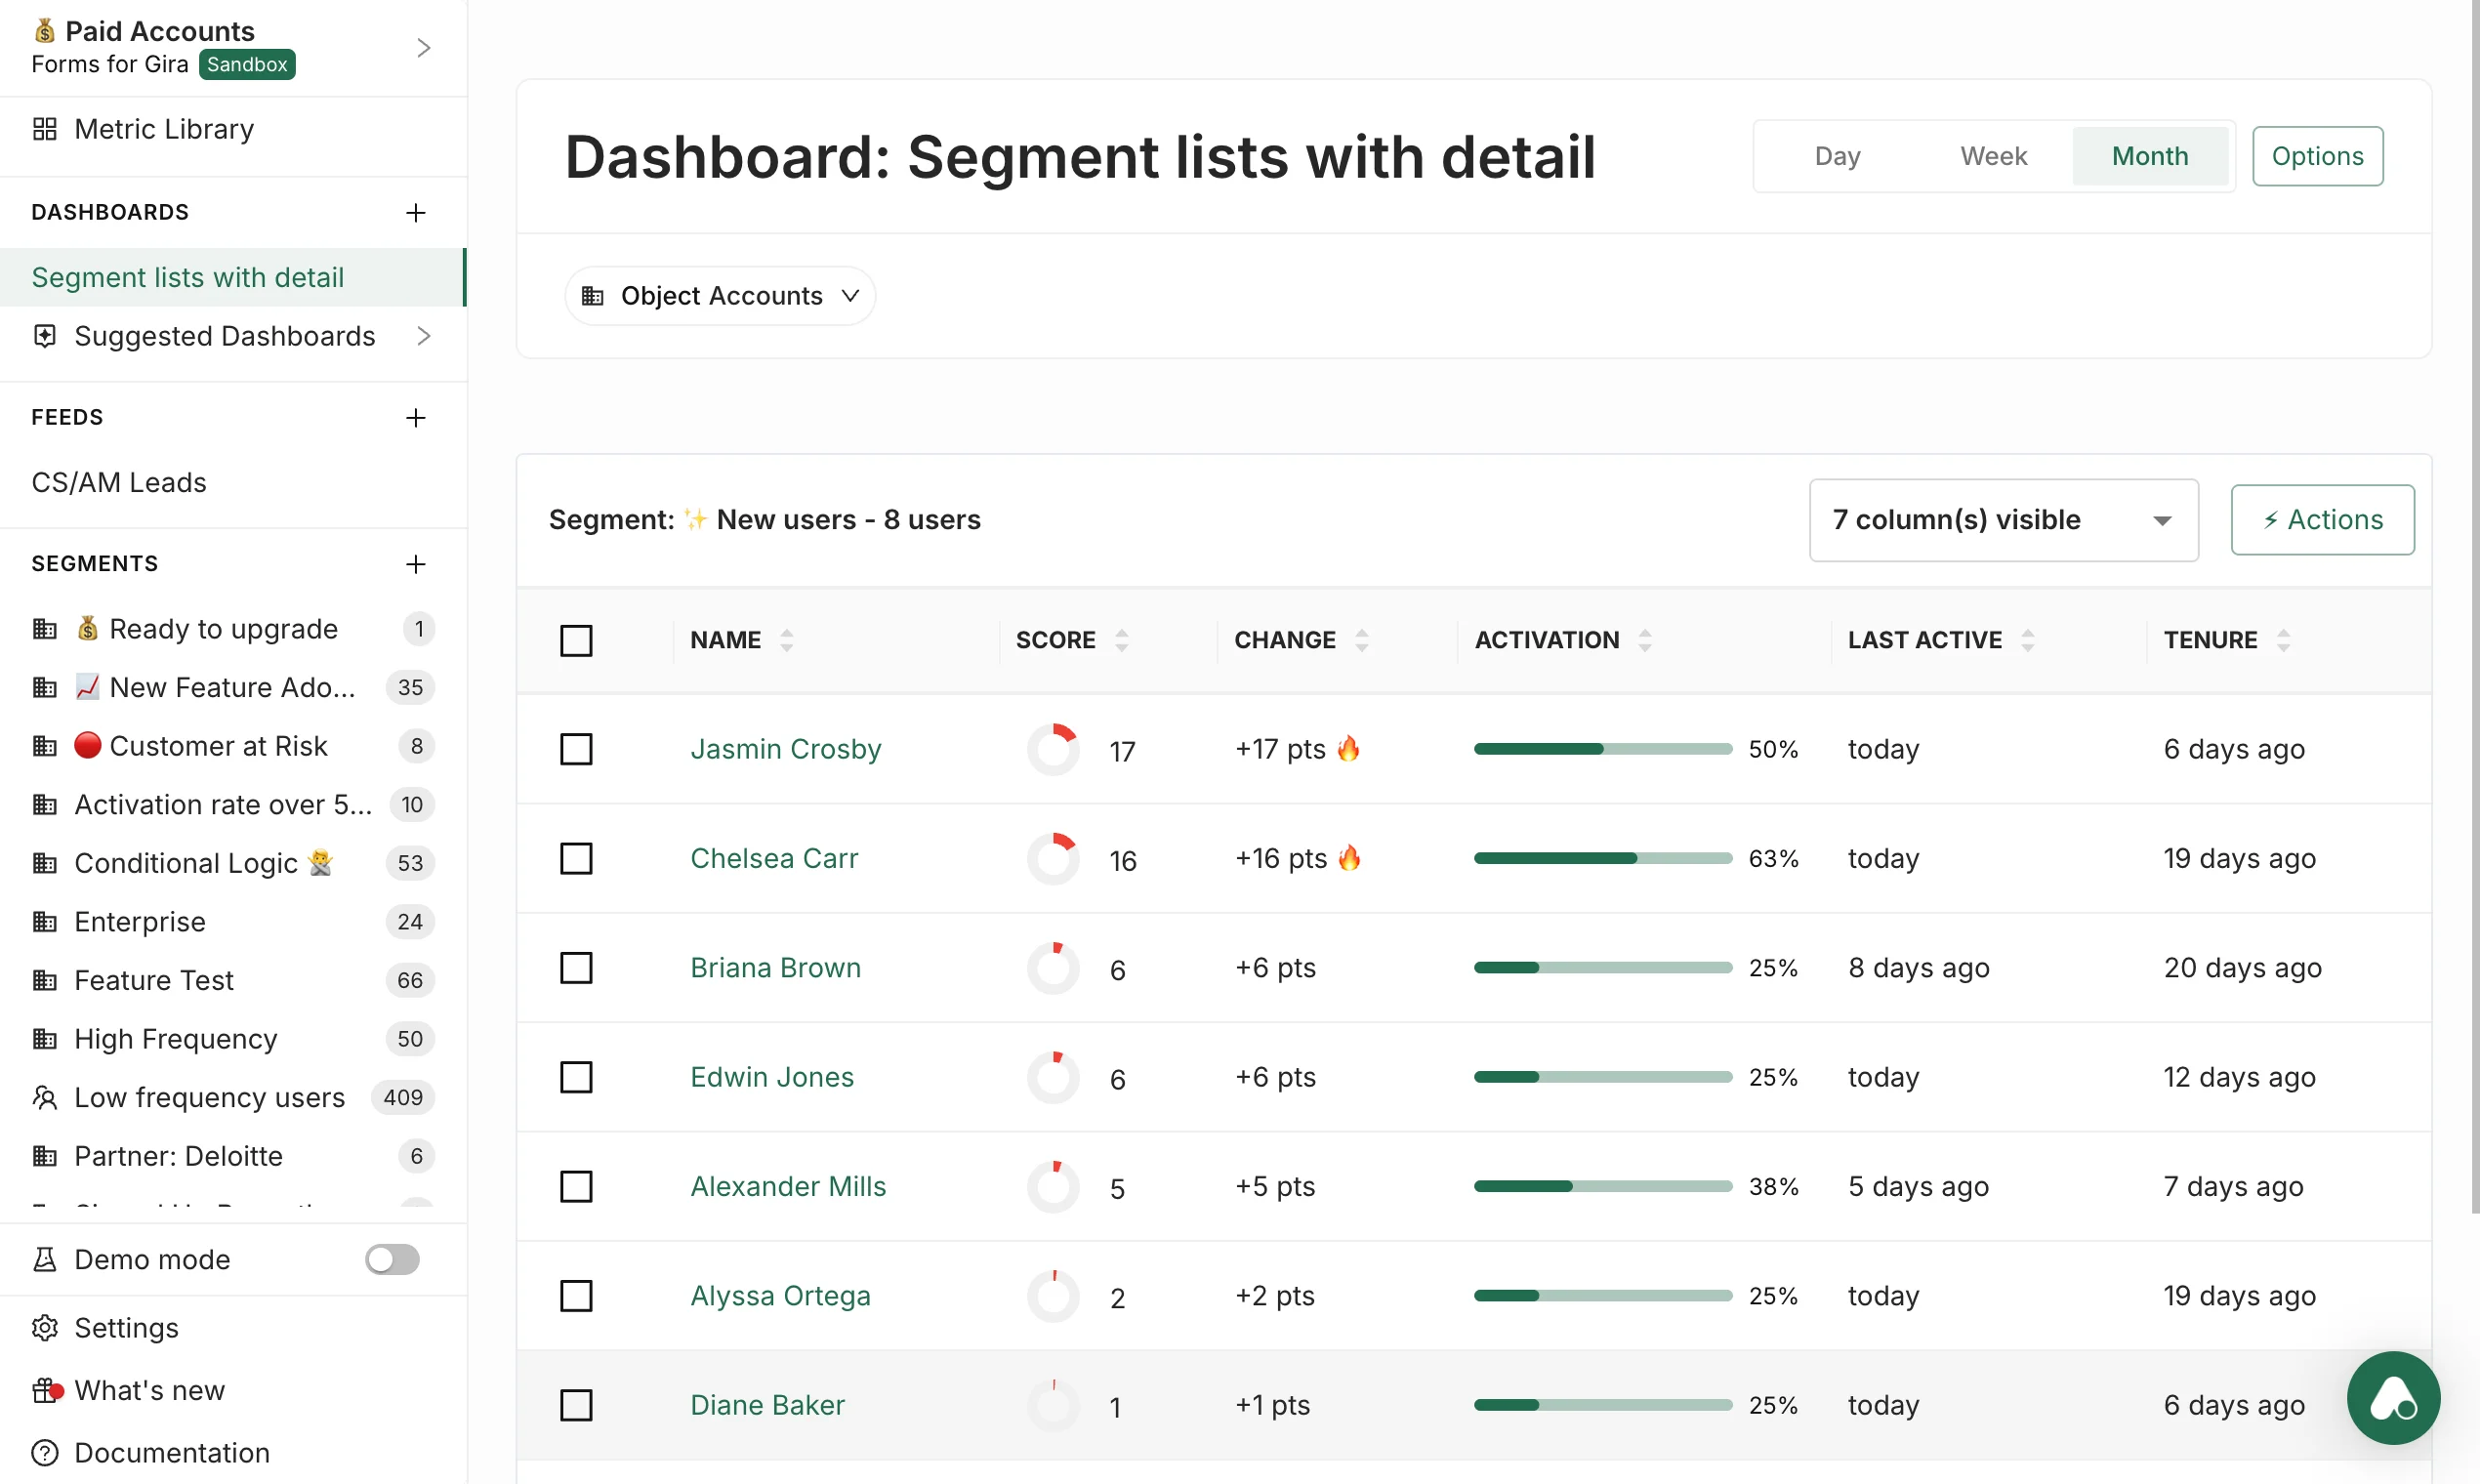
The Segment Table
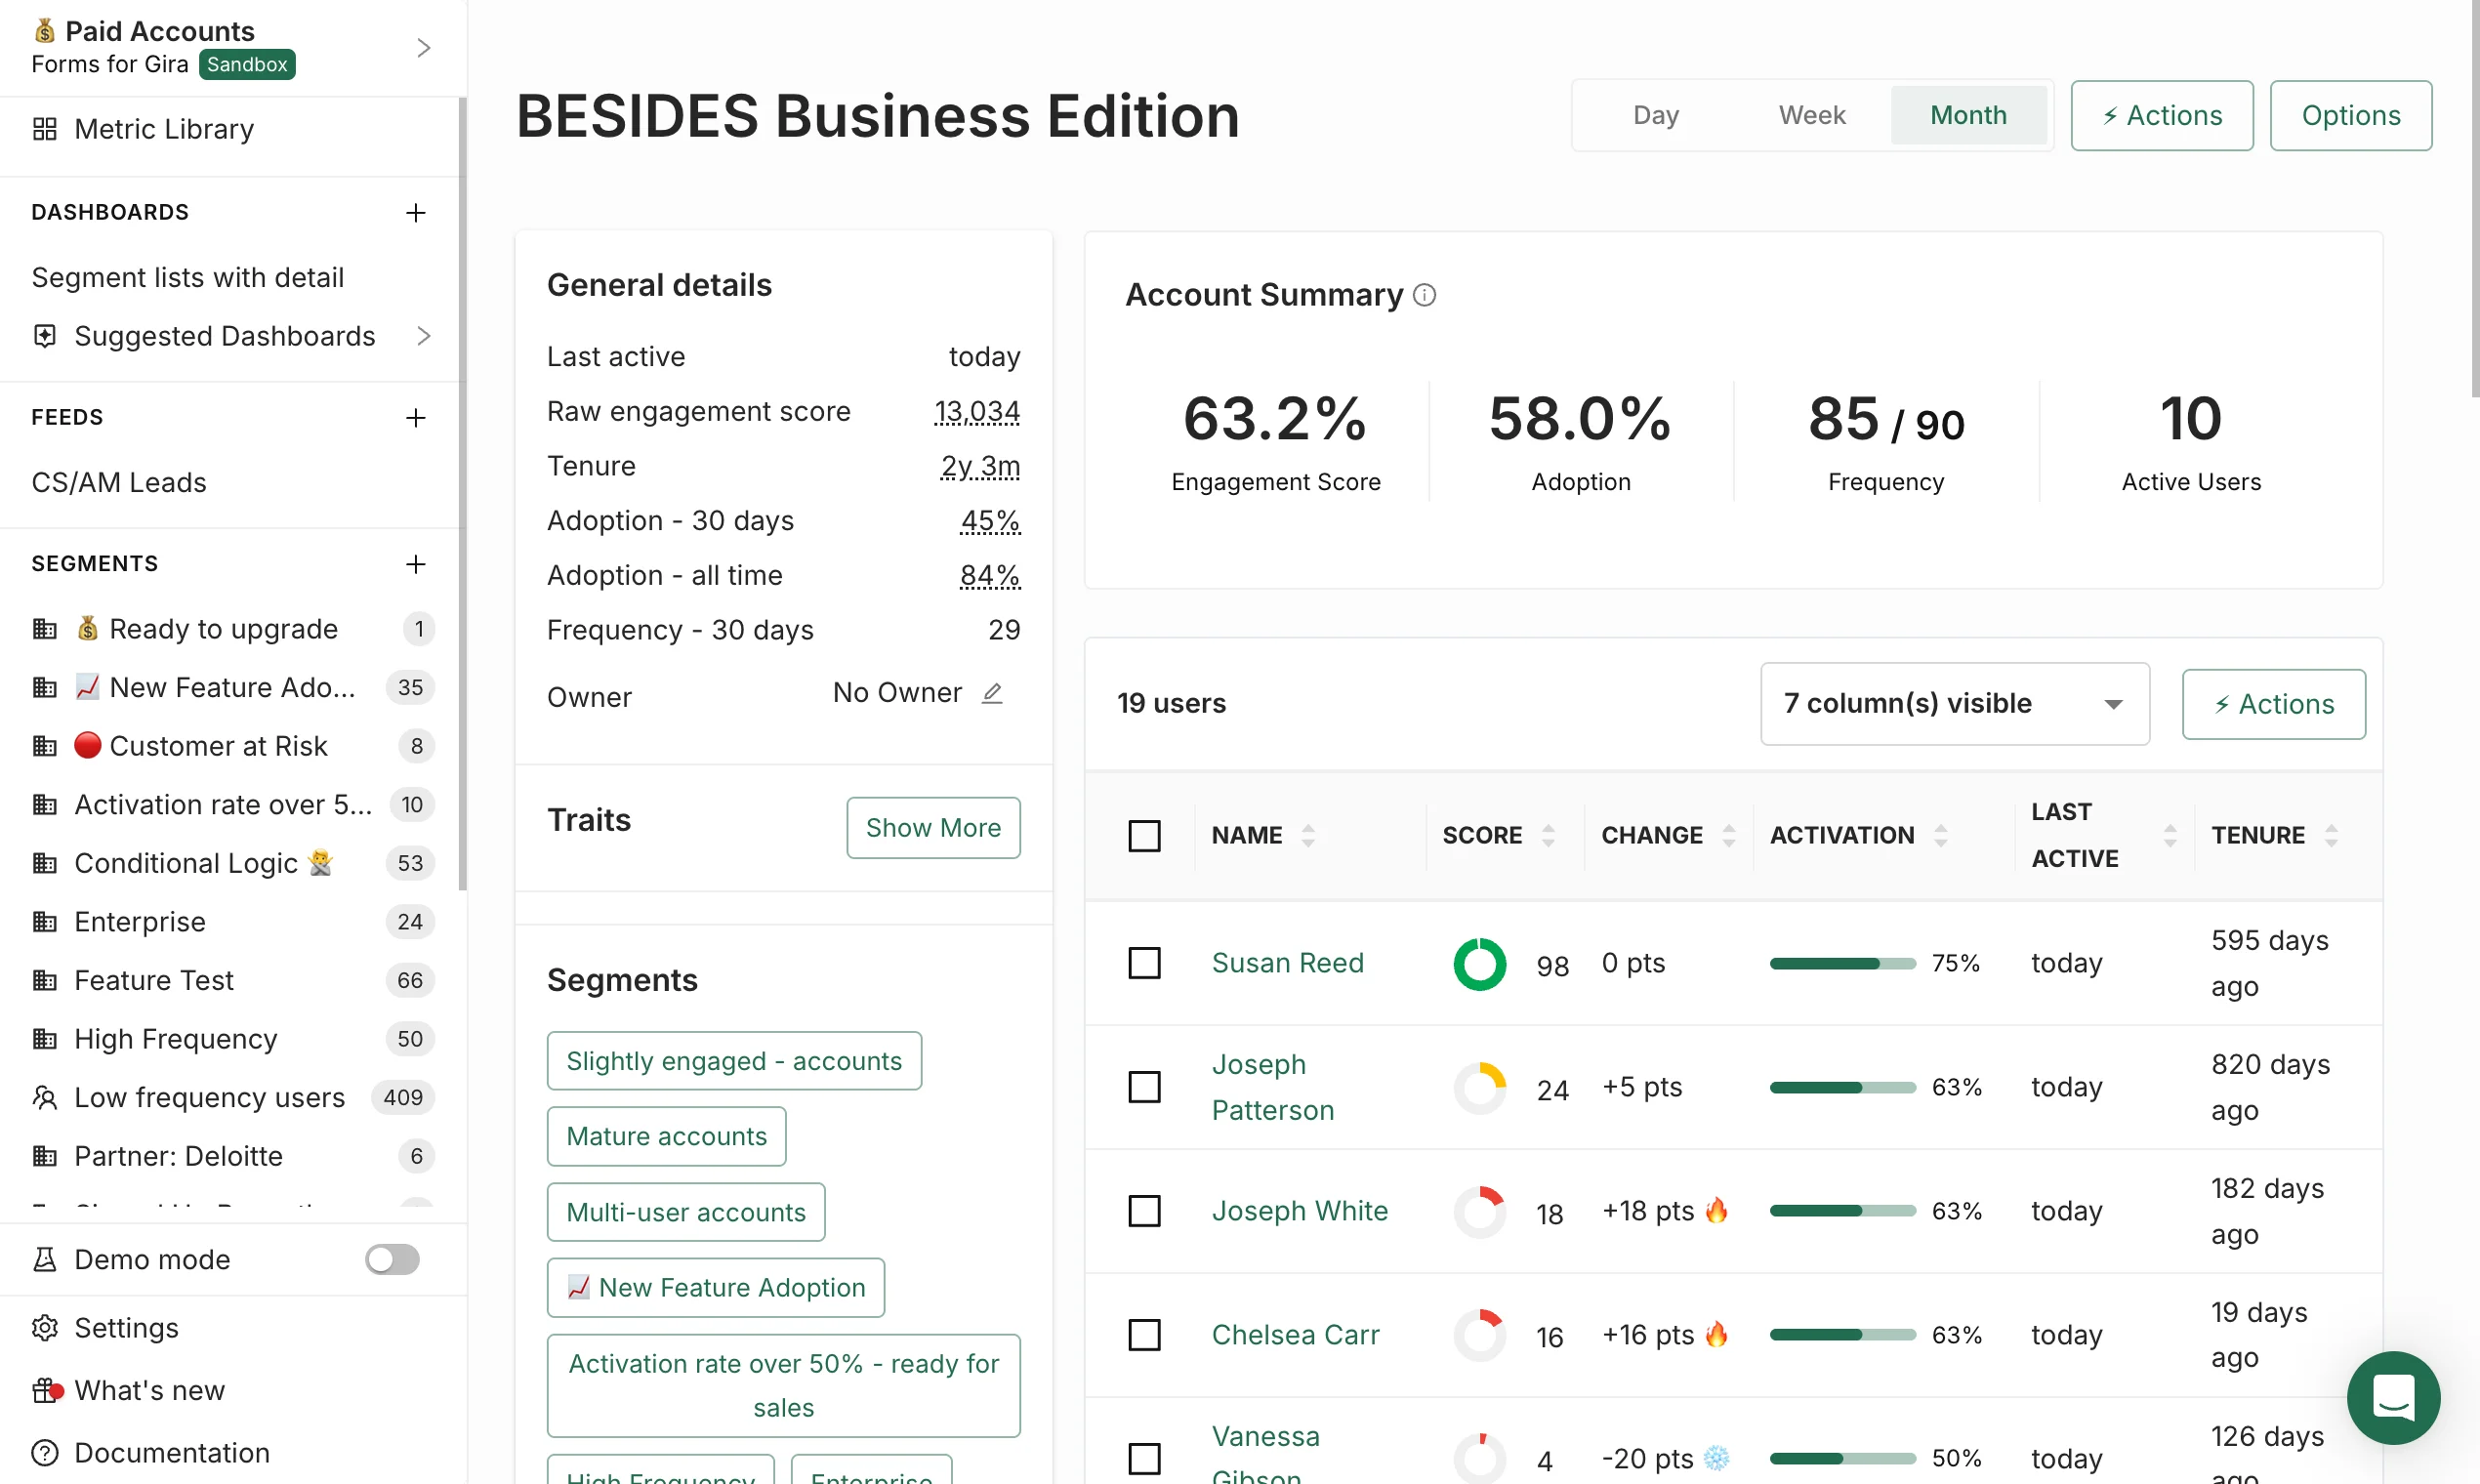
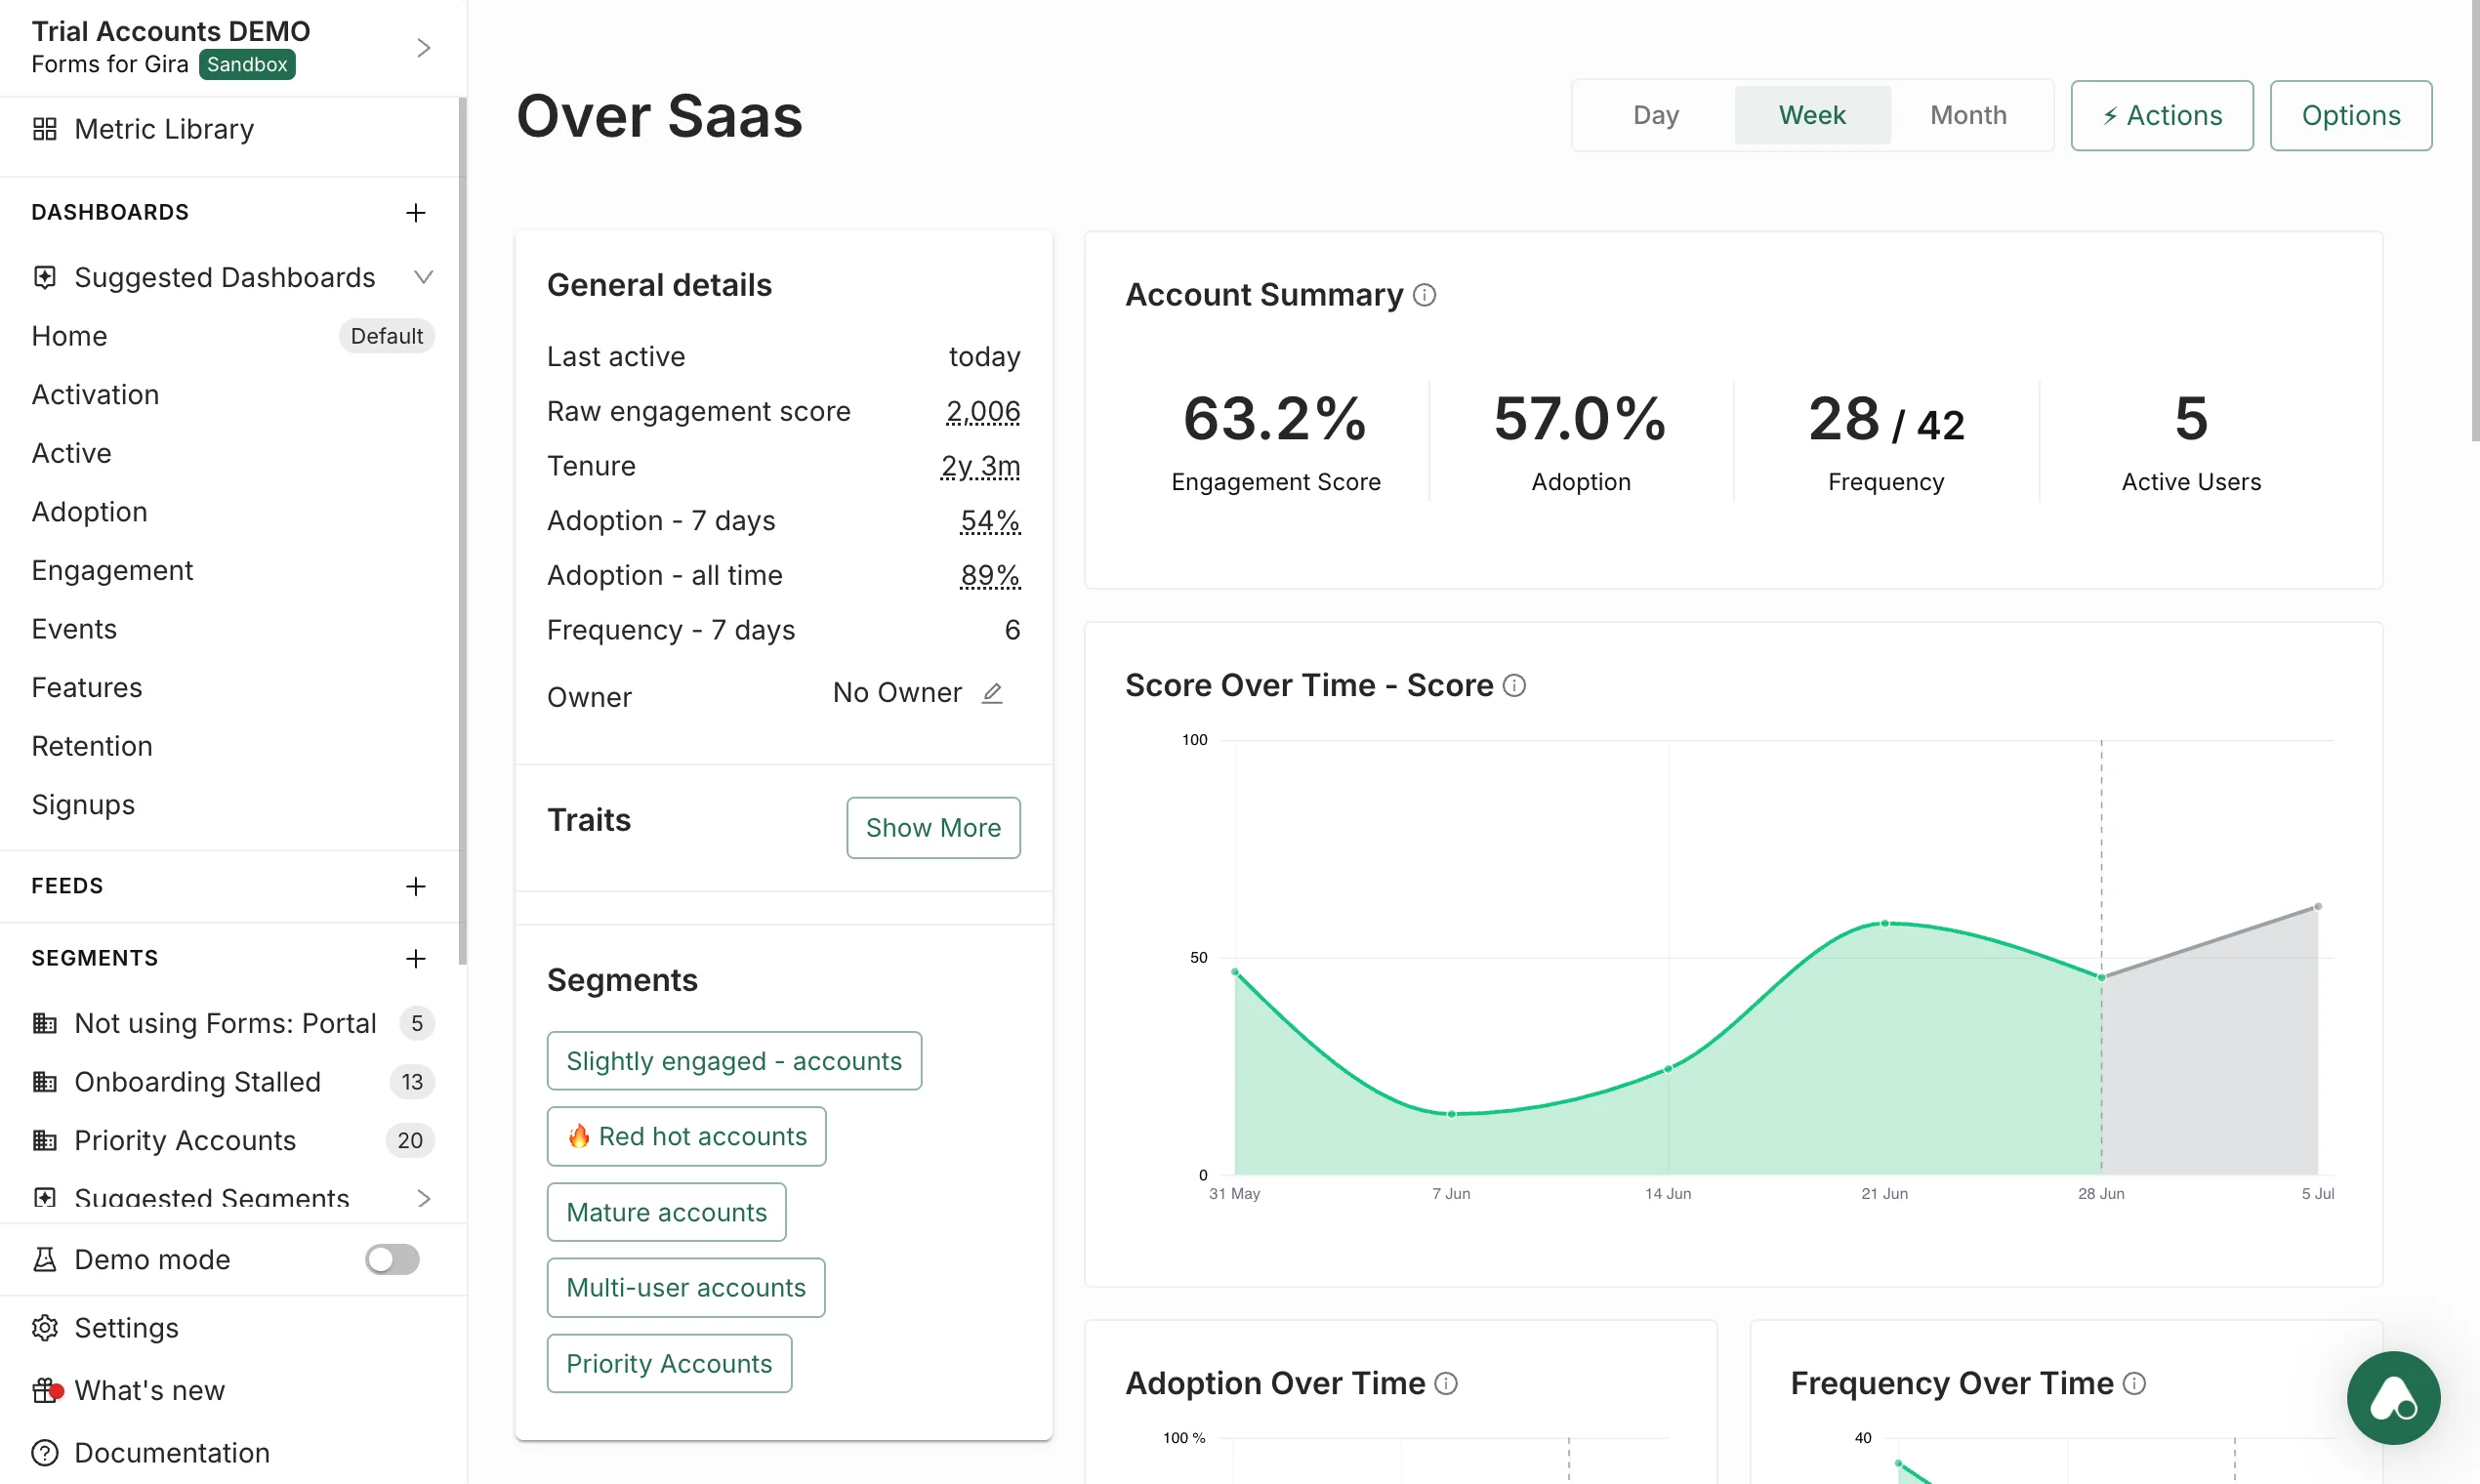
Account & user drill-down
The engagement trend
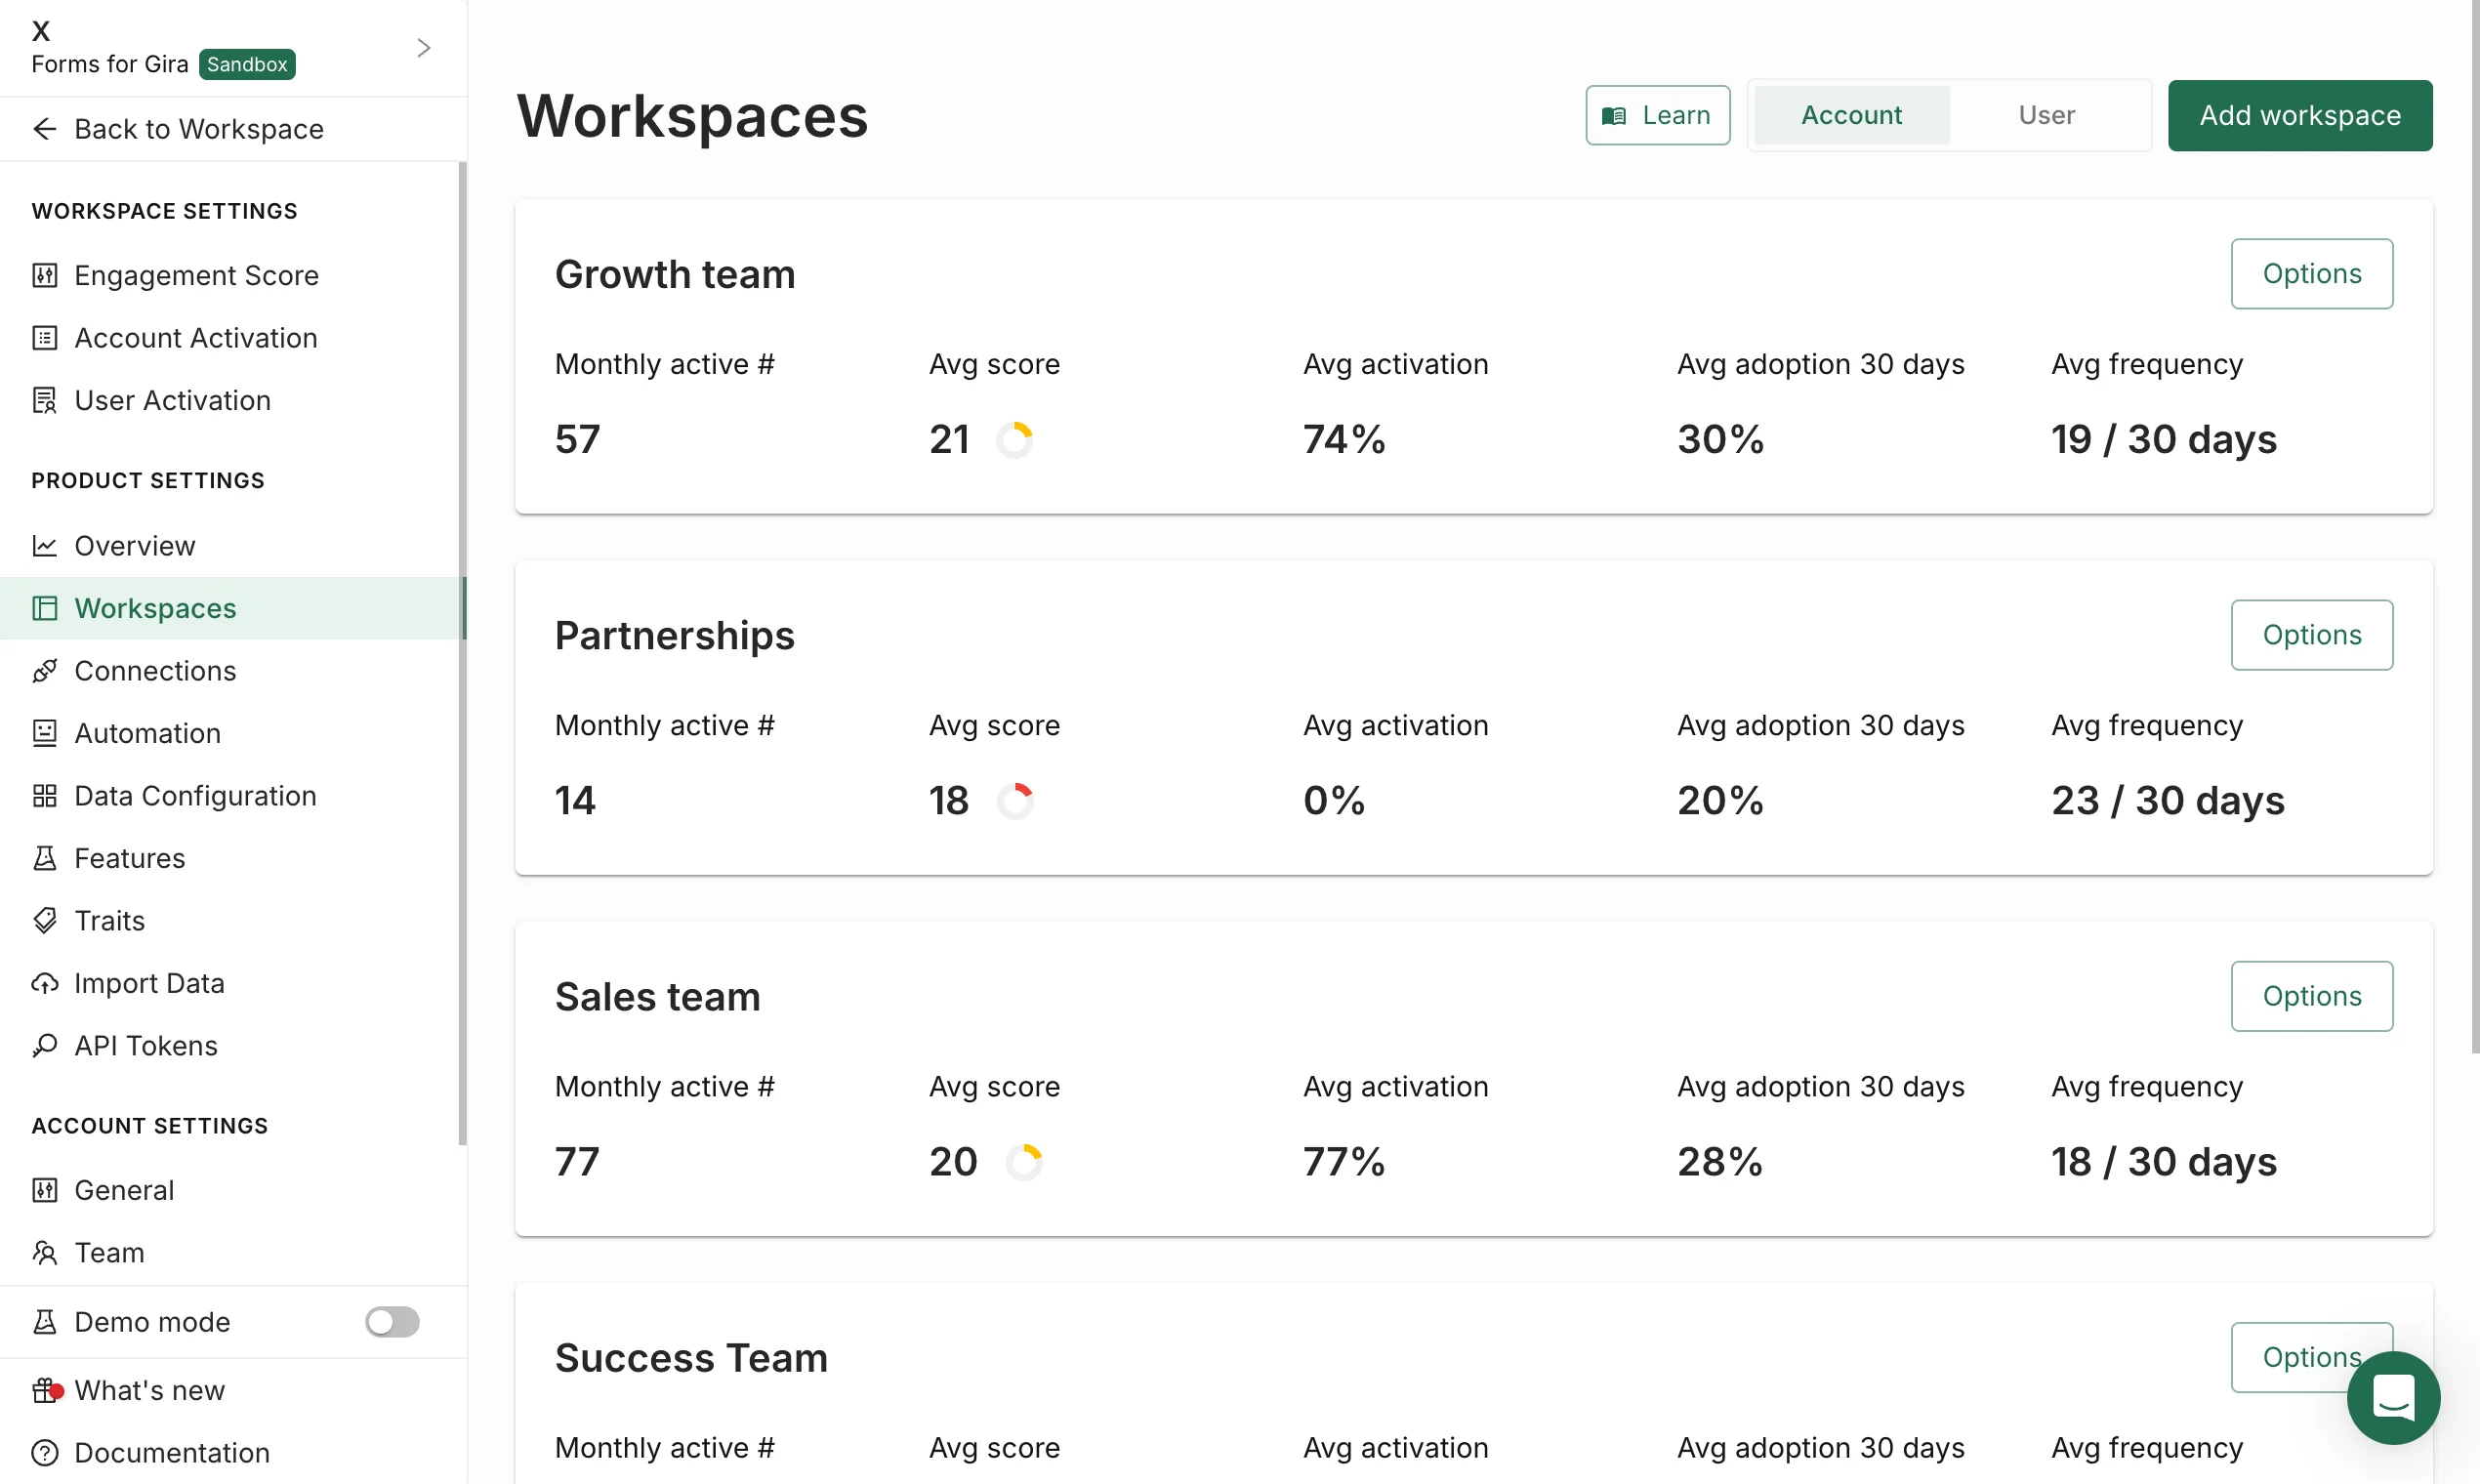
A workspace for every team
So funktioniert es
Start with the verdict
Activation Rate and the 0–100 engagement score tell you which accounts are reaching value and which are healthy.
See who to act on
The Segment Table ranks accounts by score and momentum: heating up, cooling off, going dark. The verdict becomes a right-timed worklist.
Understand why
Events, Features, Frequency, and Adoption break down what's driving the score, so you fix the cause, not the symptom.
Growth, Sales, and Success run the same three steps, each in their own workspace.
Integrationen und Aktionen
A dashboard you have to remember to open is a system of record. A signal that finds you is your system of action. Turn any metric here into a prioritized signal that reaches you and your team where you already work.
Segments
Define the threshold once: "free accounts over 70," "any account cooling 15% this week." The list keeps itself current, synced to HubSpot and Intercom.
Learn moreAutomations
Fire the action the moment an account crosses the line: a Slack message, a HubSpot task, a webhook. Wire the few that matter.
Learn moreSignals Feed
The one account most worth your time today, action attached, delivered as a daily roll-up in the tools you already live in: Slack, your CRM, your customer comms platform.
Learn moreEngagement Scores
The 0–100 verdict that powers your prioritization, flows to your CRM, and feeds your AI agents as structured context.
Learn moreWas dies ermöglicht
Leadership
- Watch NRR, activation across the base, and your top and bottom accounts
- See engagement erode before it hits revenue
- Carry a board-ready number, not a gut feel
Growth
- Watch Activation Rate, Condition Breakdown, signups, and frequency
- Turn a score threshold into a PQL list for sales
- Measure activation lift from every onboarding experiment
Sales
- Watch the Segment Table by score and momentum, plus user-level signals
- Time outreach to the score spike, not the calendar
- Walk in with usage proof, know who to call
Customer Success
- Watch the cooling segment, engagement trend, and declining frequency
- Get a cooling-accounts list every morning
- Catch silent churn before the renewal call
Product
- Watch Features Overview, Events, Adoption, and activation gaps
- Make kill-or-invest calls backed by data
- Find the activation-gating step worth redesigning
See what changed in your accounts, in under 24 hours
Connect your product data and get a clear picture of every account: scores, live segments, and the signals that say who to act on today.
- Use your existing analytics
- See account- and user-level data
- Built for B2B SaaS teams
- No credit card. Sign up, connect, and go.